
Figures & data
Figure 1 Flow diagram showing the search strategy along with the selection and screening processes for the eligible studies.
Abbreviations: DM, diabetes mellitus; HCC, hepatocellular carcinoma; HBV, hepatitis C virus.
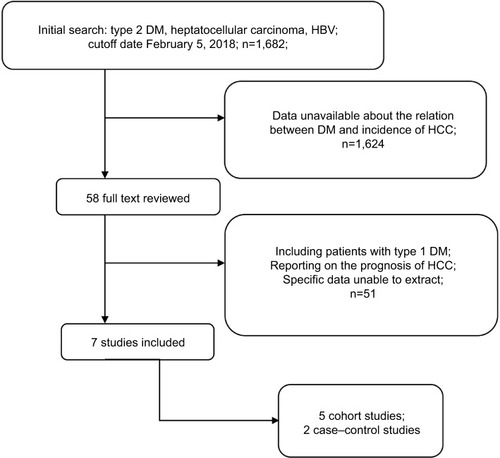
Table 1 Baseline characteristics of the seven studies included
Table 2 DM and incidence of HCC risk
Table 3 Factors adjusted in the multivariate regression analysis
Figure 2 Forest plot of meta-analysis results comparing the incidence of HCC between patients with DM and those without DM.
Abbreviations: HCC, hepatocellular carcinoma; DM, diabetes mellitus.
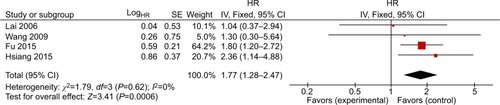
Figure 3 Funnel plot of studies assessing the relationship between DM and risk of HCC.
Abbreviations: DM, diabetes mellitus; HCC, hepatocellular carcinoma.

Figure 4 Forest plot of results comparing overall mortality between DM and non-DM subjects.
Abbreviations: DM, diabetes mellitus; NDM, non-DM; M–H, Mantel–Haenszel.
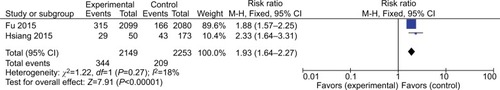
Table 4 Quality evaluation of evidence