
Figures & data
Table 1 Patient characteristics
Table 2 Univariate analysis of factors potentially associated with overall survival
Figure 1 Kaplan–Meier plots of overall survival among patients who received chemoradiotherapy for advanced NSCLC stratified by baseline TLC.
Abbreviations: NSCLC, non–small cell lung cancer; TLC, total lymphocyte count.
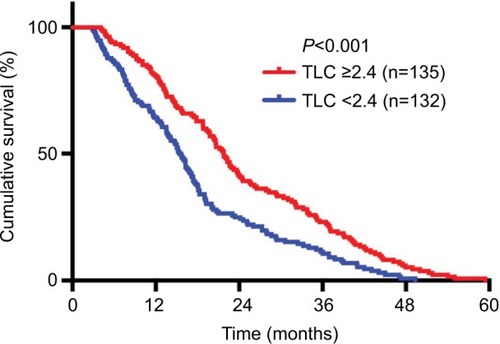
Figure 2 Kaplan–Meier plots of overall survival among patients who received chemoradiotherapy for advanced NSCLC stratified by baseline NLR.
Abbreviations: NSCLC, non–small cell lung cancer; NLR, neutrophil-to-lymphocyte ratio.
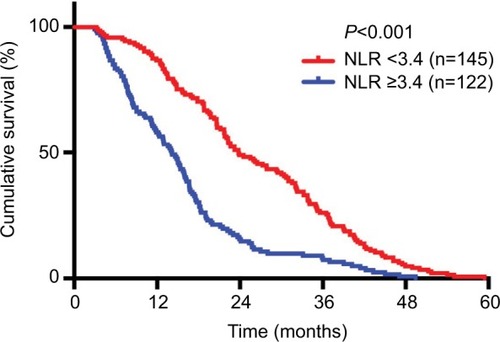
Figure 3 Kaplan–Meier plots of overall survival among patients who received chemoradiotherapy for advanced NSCLC stratified by baseline PLR.
Abbreviations: NSCLC, non–small cell lung cancer; PLR, platelet-to-lymphocyte ratio.
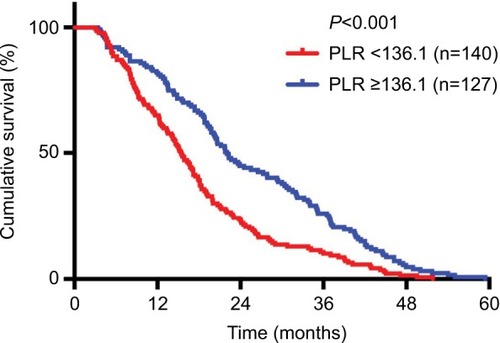
Table 3 Multivariate analysis of factors potentially associated with overall survival