Figures & data
Table 1 Interference sequences of ERO1A
Table 2 The ERO1A protein expression in cholangiocarcinoma
Table 3 The expression of ERO1A, CEA, and CA19-9 in cholangiocarcinoma
Figure 1 ERO1A protein expression in CCA tissues. (A) IHC staining for ERO1A protein expression in 222 cases of CCA tissue microarray. (B) a: Negative ERO1A staining in normal liver tissue; b: Negative ERO1A staining in CCA; c: weakly positive ERO1A staining in CCA; d: moderate positive ERO1A staining in CCA; e: strongly positive ERO1A staining in CCA (400×). (C) The expression of ERO1A, CEA, and CA19-9 in CCA tissue (200×).
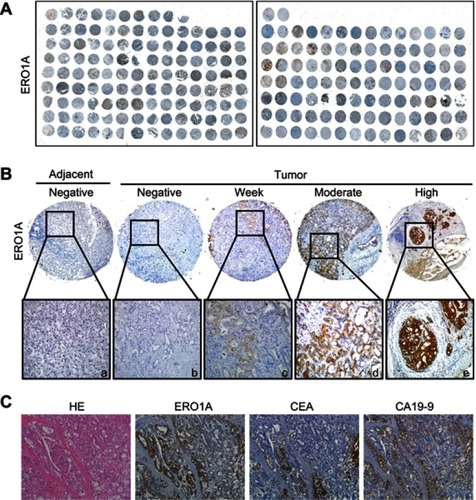
Figure 2 ERO1A protein expression in CCA cell lines. (A) Western blot analysis of ERO1A expression. (B) Localization of ERO1A was detected by immunofluorescence assay, and cytoplasmic staining was observed (400×).
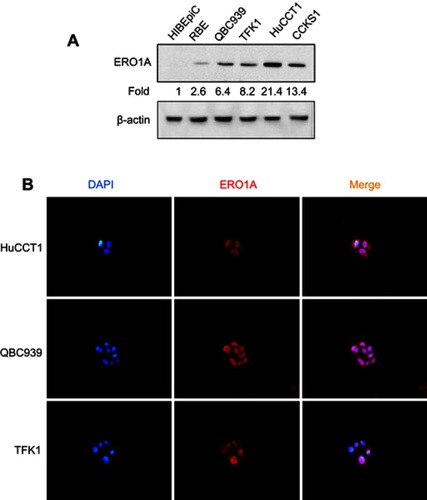
Table 4 Correlation between ERO1A expression and clinicopathologic features of cholangiocarcinoma cancer patients (statistics using percentages)
Table 5 Univariate and multivariate analysis of prognosis in patients with cholangiocarcinoma
Figure 3 Kaplan–Meier survival curves illustrating the significance of ERO1A in CCA. (A) Overall survival of patients with high and low ERO1A expression. (B) Recurrence-free survival of patients with high and low ERO1A expression. (C) Mean survival of patients with high and low ERO1A expression.
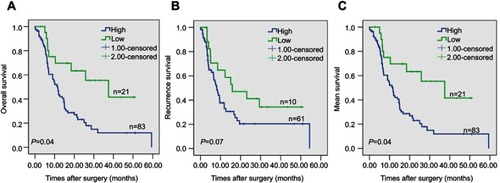
Figure 4 ERO1A depletion reduces CCA cell proliferation, colonization capacities. (A, B) Western blotting was used to detect expression of ERO1A after depletion. (C, D) The proliferation activity of ERO1A was determined by MTT assay in CCA cells. (E) Colony formation assays of HuCCT1 and QBC939 cells. (F, G) The statistical chart of colony formation assays. *P<0.05 vs NC.
Abbreviations: CON, control; NC, negative control.
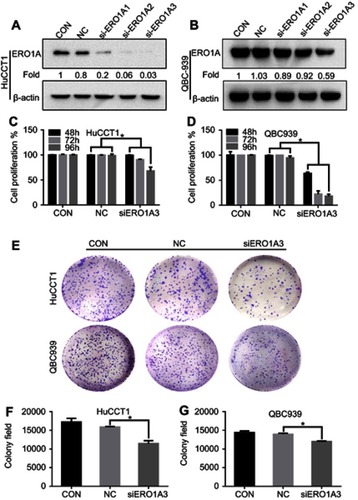
Figure 5 ERO1A depletion reduces CCA cell migration ability. (A, C) Wound healing assay was performed to detect the effect of ERO1A on the migration of CCA cells (40×). (B, D) The statistical chart of wound healing assay. (E, G) Transwell migration assay was performed to detect the effects of si-ERO1A on CCA cells migration ability (200×). (F, H) The statistical chart of migration test. *P<0.05 vs NC.
Abbreviations: CON, control; NC, negative control.
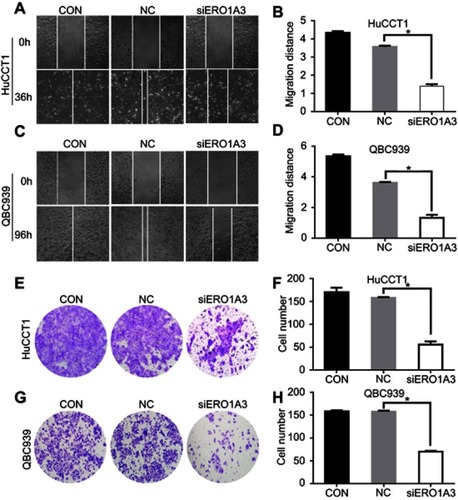
Figure 6 High expression of ERO1A enhances the proliferation and migration of CCA cells. (A) Western blotting was used to detect the expression of ERO1A after lentivirus-transfected in TFK1 cells. (B) MTT assay showed that the proliferation of TFK1 cells was enhanced. (C) Colony formation assays of TFK1 cells. (D) The statistical chart of colony formation assay. (E) Wound healing assay to detect the effects of overexpression ERO1A in CCA cells (40×). (F) The statistical chart of wound healing assay. (G) The effects of ERO1A on CCA cells migration ability were detected by migration test (200×). (H) The statistical chart of migration test. *P<0.05 vs Vector.
Abbreviation: CON, control.
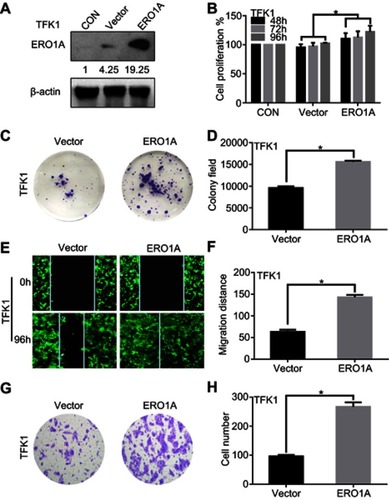
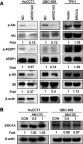
Figure 7 Correlation between ERO1A and EMT progression. (A) Relative expression level of E-cadherin was upregulated, While expression of Vimentin, Snail, Slug, was significantly downregulated in HuCCT1 and QBC939 cells. However, the results in TFK1 cells were the opposite.
Abbreviation: NC, negative control.
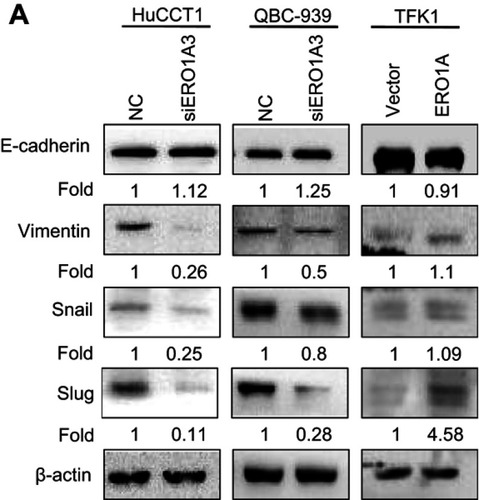
Figure 8 Correlation between ERO1A and Akt/mTOR signaling pathway. (A) Relative expression level of p-Akt, p-4EBP1 and p-S6 was significantly downregulated in HuCCT1 and QBC939 cells. However, in TFK1 cells, the results were reversed. (B) Relative protein expression level of ERO1A after Akt i1/2 was used.
Abbreviations: CON, control; NC, negative control.