
Figures & data
Figure 1 BM morphologic features.
Notes: (A-1) (Case 7): Blasts are large with multiple and irregular nuclei and large nucleoli; cytoplasm is dark blue and filled with granules and prominent cytoplasmic vacuoles (arrow). Peripheral blood (A-2) (Case 7): Auer rod (arrow). (B) (Case 9): Blasts are different in size with pleomorphic nuclei and prominent nucleoli. Multinucleate blasts (arrow). (C) (Case 10): Blasts are different in size and filled with granules and prominent cytoplasmic pseudopodia. Faggot cell (arrow). (D) (Case 3): Atypical large blasts with irregular nuclear outlines and frequent cytoplasmic vacuoles, showing large nuclei and nucleoli. (E) (Case 2): Blasts are large with prominent, multiple, and pleomorphic nuclei. Magnification ×1000.
Abbreviation: BM, bone marrow.
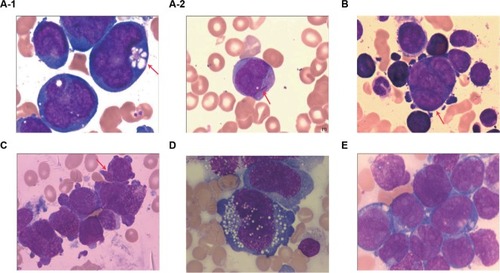
Figure 2 Karyotype and FISH analysis (Case 7).
Notes: Numbers 1–22 represent chromosomes. (A) Karyotype of diploidy (R-banding): 46, XY, t (8;21)(q22;q22). 8q-(red arrow) and 21q+ (green arrow). (B) Karyotype of tetraploidy (R-banding): 92, XXYY, t(8;21)(q22;q22)×2. 8q-(red arrow) and 21q+ (green arrow). (C) FISH analysis with GLP RUNX1–RUNX1T1 dual color fusion probe (located at 21q22/8q22). Revealing 2F4O4G signals. Two fusions on the end of 21q+, four red signals (red arrow) are on native chromosome 8 and 8q−, two green signals proximal to the centromere of 21q+ (yellow arrow), and two native chromosome 21 (green arrow). (D) FISH analysis with GLP C-MYC dual color break-apart probe (located at 8q24); the picture displays that 8q24 (MYC) (red arrow) had not moved to 21q+. (E) FISH analysis with GLP ETV6–RUNX1 dual color fusion probe (located at 12p13/21q22). Tetraploidy metaphase shows red signals (red arrow) on chromosome 12, and six green signals (green arrow) consist of two on native chromosome 21 and four on 21q+×2. Magnification ×1000.
Abbreviation: FISH, fluorescence in situ hybridization.
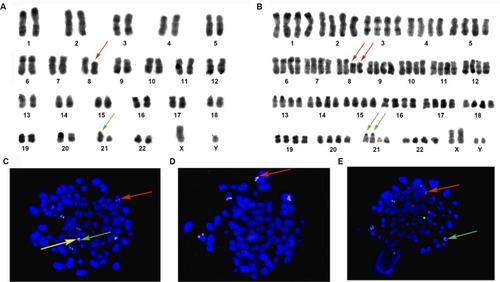
Figure 3 Karyotype and FISH analysis (Case 9).
Notes: Numbers 1 -22 represent chromosomes. (A) Karyotype (R-banding): 86, XXYY, −5, –5, –7, I (11q)×2, –13, −13, –18. Red arrow represents isodicentric 11q chromosomes. (B) FISH analysis with GLP MLL dual color break-apart probe (located at 11q23). The probe confirms two idic (11q) chromosomes (red arrow). Magnification ×1000.
Abbreviation: FISH, fluorescence in situ hybridization.
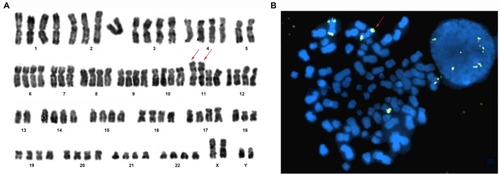
Figure 4 Genes change in near-triploid/tetraploid-AL in 10 cases.
Abbreviation: AL, acute leukemia.
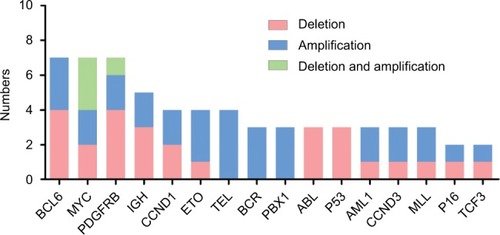
Table 1 Demographic and clinical features and treatment outcomes in near-triploidy/tetraploidy-AL patients
Table 2 Karyotypes