
Figures & data
Table 1 Patient demographic and baseline characteristics
Figure 1 Waterfall plot of the largest percentage changes from baseline in the sum of the longest tumor diameters for stage IIIA NSCLC patients.
Abbreviations: CR, complete response; NSCLC, non-small-cell lung cancer; PD, progressive disease; PR, partial response; SD, stable disease.
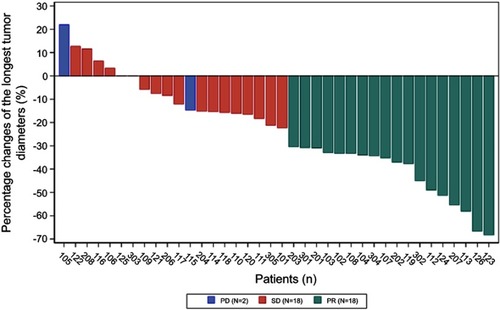
Figure 2 Kaplan-Meier curves for (A) disease-free survival (DFS) of the intention-to-treat population and (B) DFS of the intention-to-treat population stratified by EGFR mutational status.
Abbreviation: CI, confidence interval.
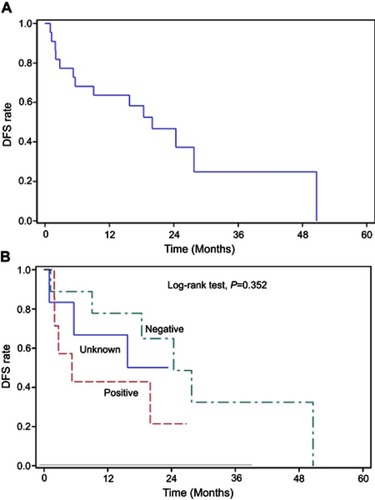
Table 2 Median DFS of stage IIIA NSCLC patients undergoing surgical resection, stratified by EGFR mutational status&
Figure 3 Kaplan-Meier curves for (A) overall survival (OS) of the intention-to-treat population, (B) OS of the intention-to-treat population stratified by surgical resection versus no surgical resection, (C) OS of the intention-to-treat population stratified by EGFR mutational status, and (D) OS of surgical patients stratified by EGFR mutational status.
Abbreviation: CI, confidence interval.
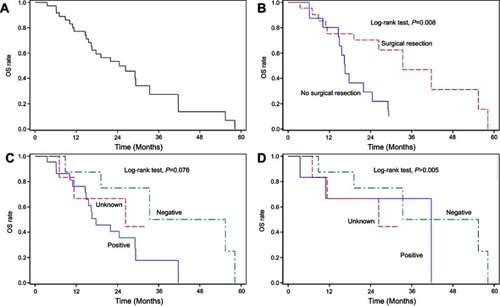
Table 3 Adverse events (all grades >10%); n(%)
Table S1 Univariate analysis of determinants of the objective response rate in the intention-to-treat population