
Figures & data
Figure 1 Literature search and selection.
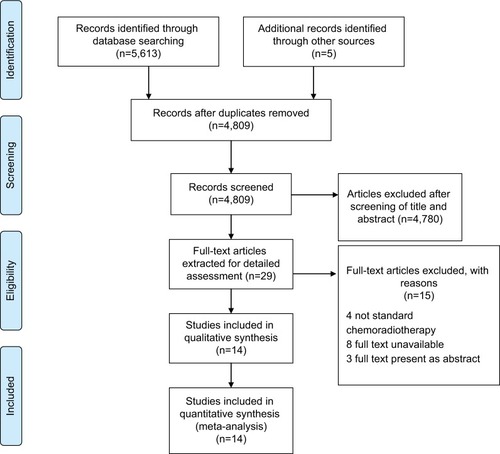
Table 1 Characteristics of the studies included in the meta-analysis, by first author
Table 2 Characteristics of neoadjuvant CRT regimes included in the meta-analysis, by first author
Figure 2 Risk-of-bias graph.
Note: Red, yellow, and green represent high, unclear, and low risk of bias, respectively.
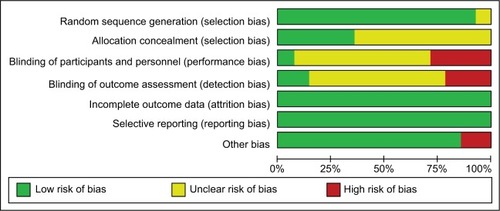
Figure 3 Risk-of-bias summary.
Note: Red, yellow, and green represent high, unclear, and low risk of bias, respectively.
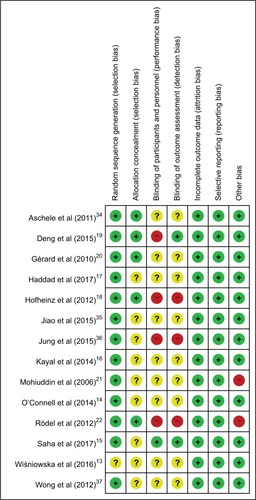
Figure 4 Network plot of chemoradiotherapy regimens: (A) pCR and (B) toxic effects.
Abbreviations: 5FU, fluorouracil; CAP, capecitabine; CDDP, cisplatin; CPT-11, irinotecan; OXA, oxaliplatin; pCR, pathologic complete response; S1, combined tegafur, 5-chloro-2,4-dihydroxypyridine, and potassium oxonate.
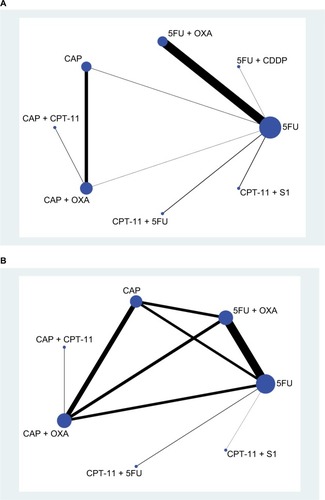
Figure 5 Evidence contribution plot: (A) pCR and (B) toxic effects.
Note: A: 5FU; B: 5FU + OXA; C: CAP; D: CAP + OXA; E: CAP + CPT-11; F: CPT-11+5FU; G: CPT-11+ S1; H: 5FU + CDDP.
Abbreviations: 5FU, fluorouracil; CAP, capecitabine; CDDP, cisplatin; CPT-11, irinotecan; OXA, oxaliplatin; pCR, pathologic complete response; S1, combined tegafur, 5-chloro-2,4-dihydroxypyridine, and potassium oxonate.
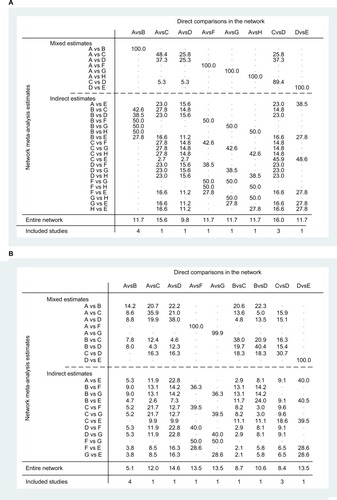
Figure 6 Inconsistency test results of the (A) pCR and (B) toxic effects.
Note: A: 5FU; B: 5FU + OXA; C: CAP; D: CAP + OXA.
Abbreviations: 5FU, fluorouracil; CAP, capecitabine; IF, inconsistency factor; OXA, oxaliplatin; pCR, pathologic complete response.
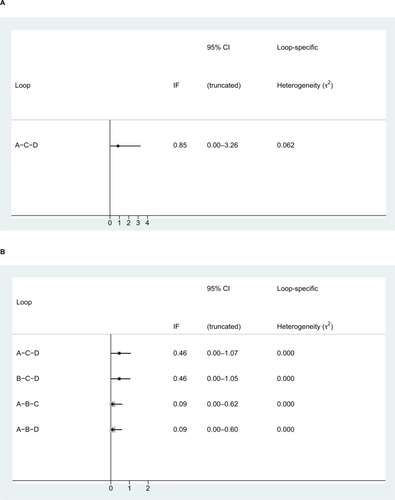
Figure 7 The interval plot of the ORs, their 95% CIs, and prediction intervals (red extensions) of the (A) pCR and (B) toxic effects.
Note: A: 5FU; B: 5FU + OXA; C: CAP; D: CAP + OXA; E: CAP + CPT-11; F: CPT-11+5FU; G: CPT-11+ S1; H: 5FU + CDDP.
Abbreviations: 5FU, fluorouracil; CAP, capecitabine; CDDP, cisplatin; CPT-11, irinotecan; OXA, oxaliplatin; pCR, pathologic complete response; PrI, prediction interval; S1, combined tegafur, 5-chloro-2,4-dihydroxypyridine, and potassium oxonate.
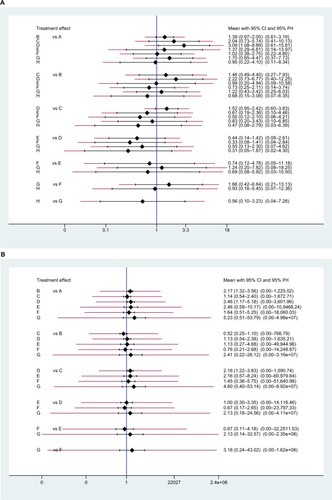
Figure 8 Funnel plot for publication bias in selected studies of the (A) pCR and (B) toxic effects.
Note: A: 5FU; B: 5FU + OXA; C: CAP; D: CAP + OXA; E: CAP + CPT-11; F: CPT-11+5 FU; G: CPT-11+ S1; H: 5FU + CDDP.
Abbreviations: 5FU, fluorouracil; CAP, capecitabine; CDDP, cisplatin; CPT-11, irinotecan; OXA, oxaliplatin; pCR, pathologic complete response; S1, combined tegafur, 5-chloro-2,4-dihydroxypyridine, and potassium oxonate.
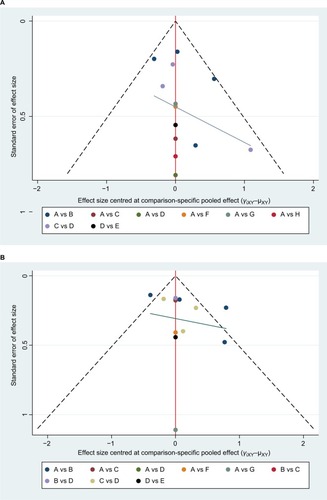
Figure 9 SUCRA for the cumulative probabilities of the (A) pCR and (B) toxic effects.
Note: A: 5FU; B: 5FU + OXA; C: CAP; D: CAP + OXA; E: CAP + CPT-11; F: CPT-11+5FU; G: CPT-11+ S1; H: 5FU + CDDP.
Abbreviations: 5FU, fluorouracil; CAP, capecitabine; CDDP, cisplatin; CPT-11, irinotecan; OXA, oxaliplatin; pCR, pathologic complete response; S1, combined tegafur, 5-chloro-2,4-dihydroxypyridine, and potassium oxonate; SUCRA, surface under the cumulative ranking curve.
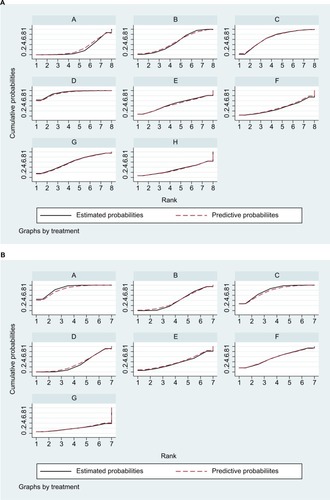
Table 3 SUCRA of each CRT regime with regard to the rate of pCR
Table 4 SUCRA of each CRT regime with regard to the rate of toxic effect