
Figures & data
Table 1 Clinicopathologic characteristics of patients with nonmetastatic colorectal cancers
Table 2 Distribution of tissue CD133+ CD44+ CSCs and tissue CD133− CD44− tumor cells among different cell cycle phases and their significance
Figure 1 Flow cytometric detection of cancer colon circulating cancer stem cells.
Notes: (A) CD45 and side scatter histogram were used to select the CD45−cells. (B) The expression of CD133 and CD44 on CD45− cells was then assessed. Circulating stem cells are CD45− CD44+ CD133+.
Abbreviations: CSCs, cancer stem cells; PE, phycoerythrin.
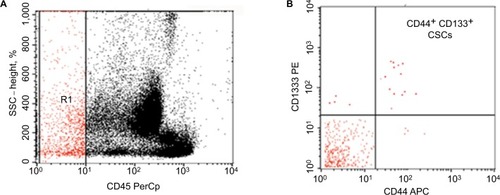
Figure 2 Flow cytometric detection of cancer stem cells in primary tissue of cancer colon and cell cycles of sorted CD133+ CD44+ cells and CD133− CD44− cells.
Notes: (A, B) The expressions of CD133 and CD44 were assessed on tumor cells. Then, CD133+ CD44+ and CD133− CD44− cells were selected and sorted by using cell sorter of the FACSCalibur flow cytometer. (C, D) The cell cycle of isolated CD133+ CD44+ and CD133− CD44− cells.
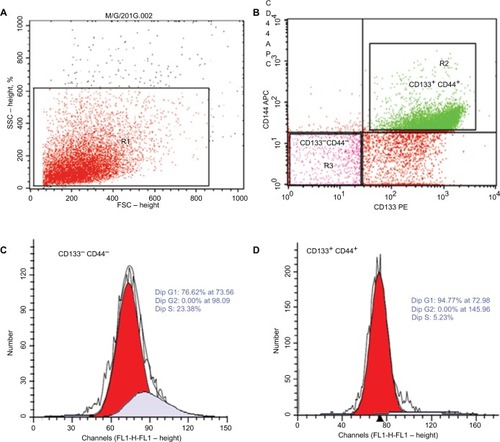
Figure 3 Correlation between circulating CSCs and tissue CD133+ CD44+ CSCs (r=+0.677, P<0.001).
Abbreviations: CSCs, cancer stem cells; TSC, tissue cancer stem cells.
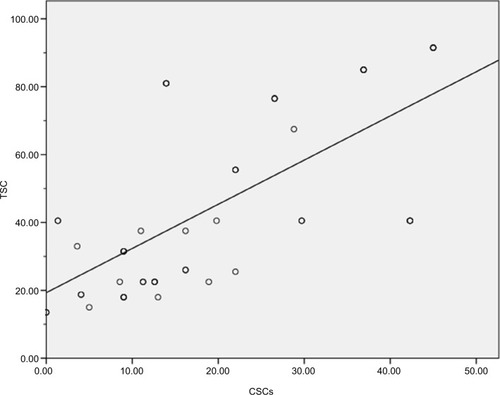
Figure 4 The median DFS of patients with nonmetastatic colorectal cancers.
Note: The median DFS of 50 patients with nonmetastatic colorectal cancers was 19±2.638 months (95% CI=13.840–24.160).
Abbreviation: DFS, disease-free survival.
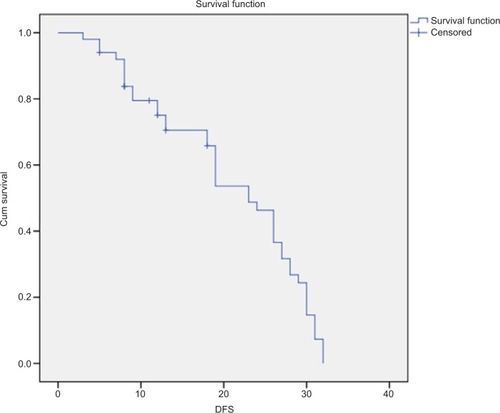
Figure 5 The median OS of patients with colorectal cancers.
Note: The median OS of 50 patients with colorectal cancers was 23±1.755 months (95% CI=19.560–26.440).
Abbreviation: OS, overall survival.
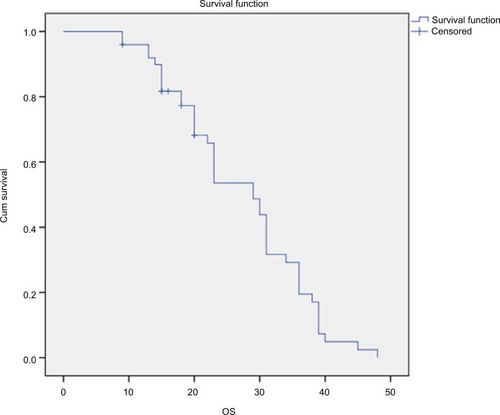
Table 3 Univariate analysis of prognostic factors
Table 4 The relations between circulating CSCs, tissue CD133+ CD44+ CSCs, and CD133− CD44− tumor cells with DFS and OS
Table 5 Multivariate analysis of different prognostic factors on DFS and OS
Table 6 Relations between circulating CSCs and tissue CD133+ CD44+ CSCs with different clinical characteristics