Figures & data
Table 1 Characteristic of included studies
Table 2 Demographics and baseline characteristics
Figure 1 Flow chart of study selection.
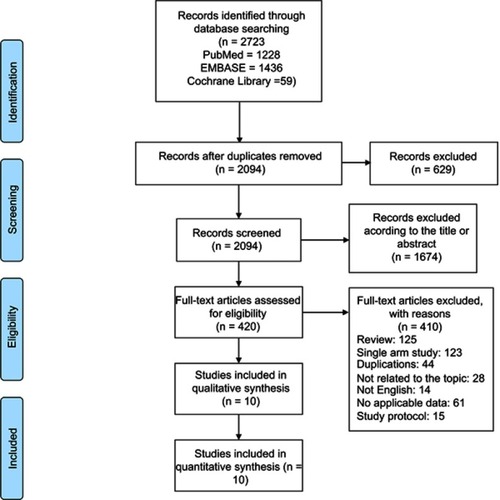
Figure 2 The forest plot of the comparison in terms of (A) 1-year, (B) 3-year rate, and (C) 5-year overall survival rate.
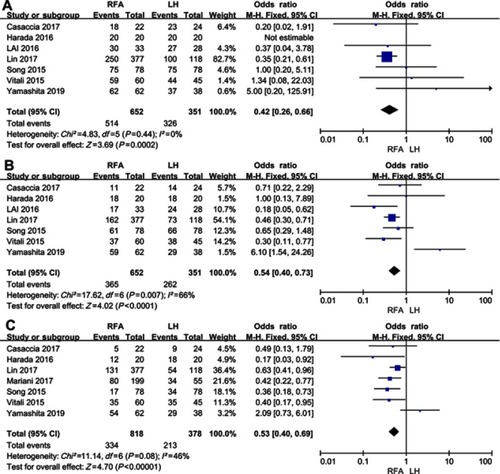
Figure 3 The forest plot of the comparison in terms of (A) 1-year, (B) 3-year rate, and (C) 5-year disease-free survival rate.
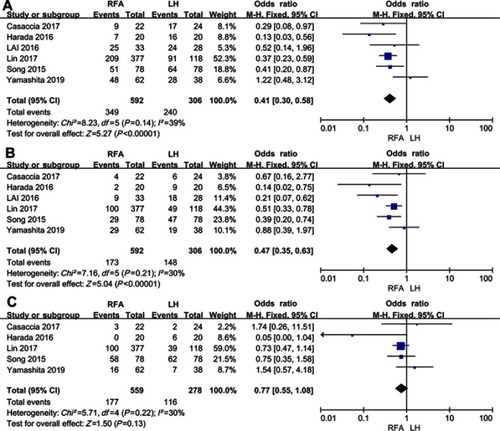
Figure 4 The forest plot of the comparison in terms of (A) 1-year, (B) 2-year rate, and (C) 3-year local recurrence rate.
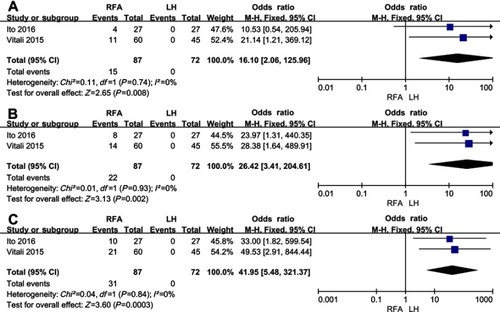
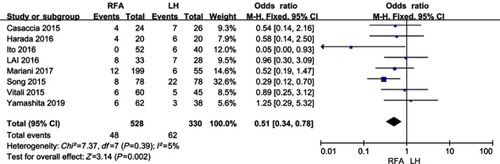
Figure 5 The forest plot of the comparison in terms of the complications.
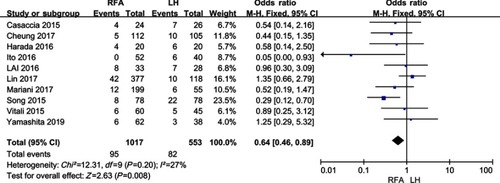
Figure 6 The forest plot of the comparison in terms of (A) 1-year, (B) 3-year rate, and (C) 5-year overall survival rate (subgroup analysis for small hepatocellular carcinoma).
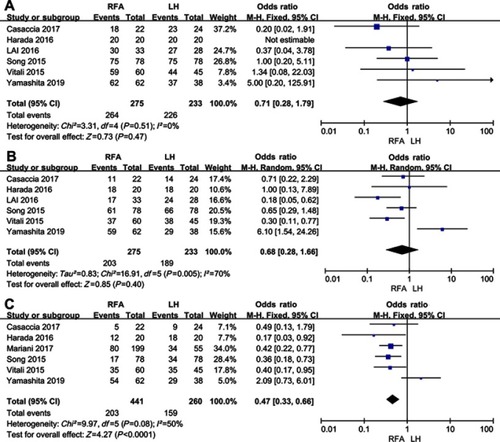
Figure 7 The forest plot of the comparison in terms of (A) 1-year, (B) 3-year rate, and (C) 5-year disease-free survival rate (subgroup analysis for small hepatocellular carcinoma).
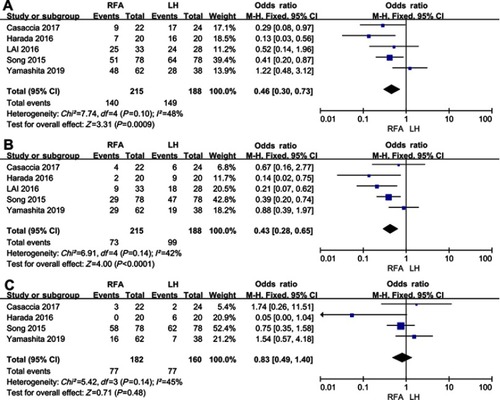
Figure S1 The funnel plot for the comparison of overall survival rate.
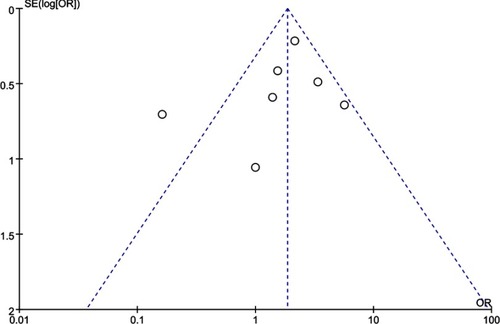
Figure S2 The funnel plot for the comparison of disease-free survival rate.
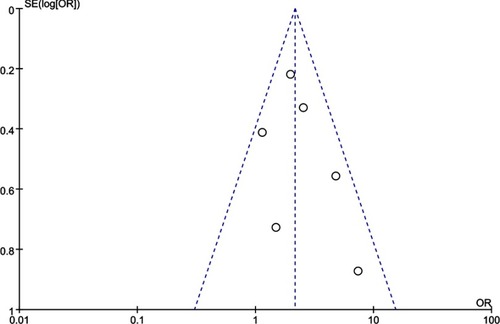
Figure S3 The funnel plot for the comparison of complications.
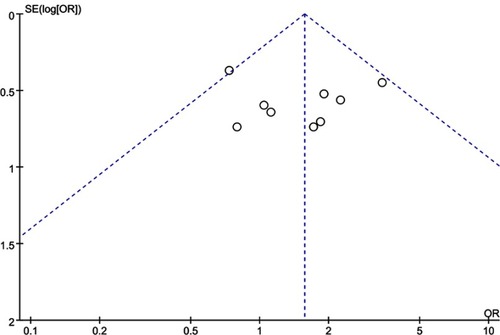
Figure S4 Forest plots of studies included comparing the complications between LH and RFA (subgroup analysis for small hepatocellular carcinoma).