Figures & data
Figure 1 Study design and data preprocessing.
Note: Flow diagram of study.
Abbreviations: DEGs, differentially expressed genes; EOC, epithelial ovarian cancer; GEO, Gene Expression Omnibus; GEPIA, Gene Expression Profiling Interactive Analysis; GO, gene ontology; KEGG, Kyoto Encyclopedia of Genes and Genomes; PPI, protein–protein interaction.
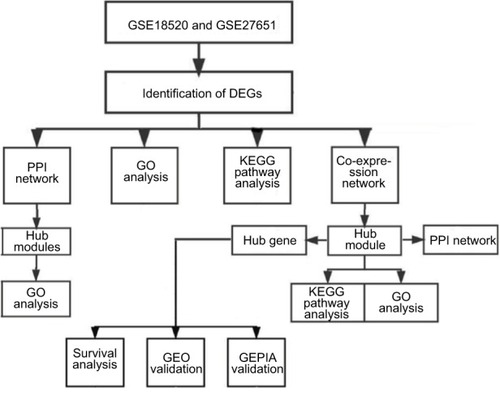
Figure 2 Identification of DEGs in EOC and the enrichment of these genes.
Notes: (A) The volcano plot of all DEGs. (B) Heatmap of the top 100 DEGs according to the value of |logFC|. Drawing of heatmap was performed through the “heatmap” package in R 3.4.4. (C) In GO analysis of DEGs, upregulated DEGs with fold change >1. (D) In GO analysis of DEGs, downregulated DEGs with fold change >1. (E) In KEGG analysis of DEGs, upregulated DEGs with fold change >1. (F) In KEGG analysis of DEGs, downregulated DEGs with fold change >1.
Abbreviations: adj.P.val, adjusted P-value; DEGs, differentially expressed genes; FC, fold change; GO, gene ontology; KEGG, Kyoto Encyclopedia of Genes and Genomes; NoDEG, non-DEG.
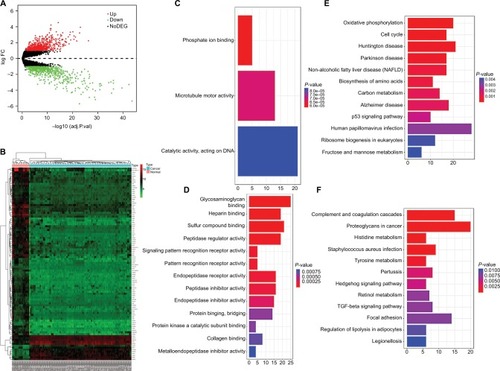
Figure 3 Cluster analysis of the PPI network.
Notes: (A) 1,700 DEGs were filtered into the DEGs PPI network complex that contained 1,467 nodes and 185 edges. (B) Histogram of key proteins. The y-axis represents the name of genes, the x-axis represents the number of adjacent genes, and height is the number of gene connections.
Abbreviations: DEGs, differentially expressed genes; PPI, protein–protein interaction.
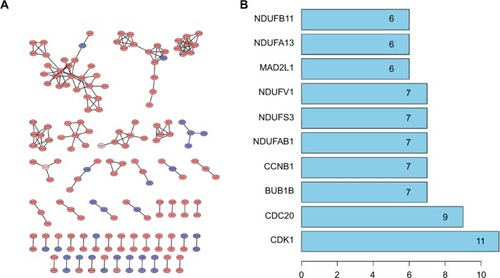
Figure 4 Module analysis of PPI network.
Notes: (A) Module rank 1. This cluster contained 7 nodes and 21 edges and has the highest score in those clusters. (B) Module rank 2. This cluster contained 5 nodes and 10 edges and had the second highest score in those clusters.
Abbreviation: PPI, protein–protein interaction.
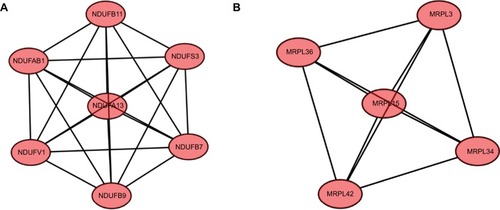
Figure 5 Determination of soft-thresholding power in WGCNA.
Notes: (A) GO enrichment analysis of module rank 1, (B) KEGG analysis of module rank 1.
Abbreviations: GO, gene ontology; KEGG, Kyoto Encyclopedia of Genes and Genomes; WGCNA, Weighted Gene Expression Network Analysis.
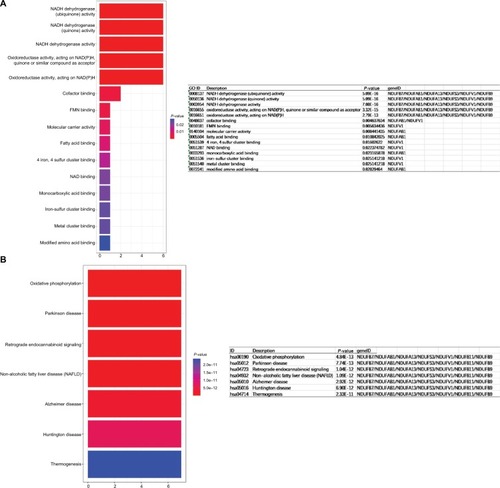
Figure 6 Hub module selection.
Notes: (A) Samples clustering of GSE18520 and GSE27651. The clustering was based on the expression data of differentially expressed genes between tumor samples and normal samples in EOC. The color intensity was proportional to tumor samples and normal samples. (B) Dendrogram of all differentially expressed genes clustered based on a dissimilarity measure (1-TOM). (C) Dendrogram of consensus module eigengenes obtained by WGCNA on the consensus correlation. The red line was the merging threshold, and groups of eigengenes below the threshold represent modules whose expressions profiles should be merged due to their similarity. (D) Correlation between modules and traits. The upper number in each cell referred to the correlation coefficient of each module in the trait, and the lower number was the corresponding P-value. Among them, the turquoise module was the most relevant module with cancer traits.
Abbreviation: TOM, topological overlap matrix.
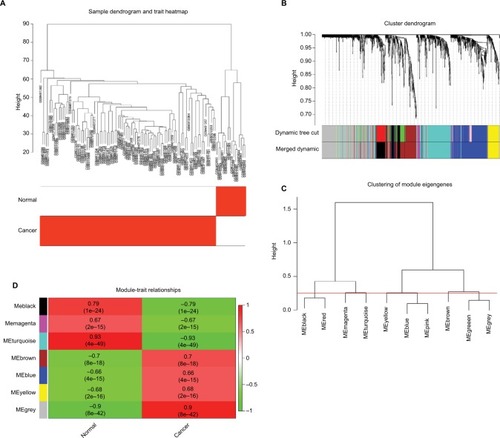
Figure 7 Select hub genes in hub modules.
Notes: (A) A scatter plot of GS for epithelial ovarian cancer vs the MM in the turquoise module. Intramodular analysis of the genes found in the turquoise module, which contained genes that had a high correlation with epithelial ovarian cancer, with P<1.5e–125 and correlation =0.91. (B) A heatmap of all genes. The intensity of the red color indicated the strength of the correlation between pairs of modules on a linear scale. (C) Dendrogram of merged module eigengenes obtained by WGCNA. Heatmap plot of the adjacencies of modules. Red represented high adjacency (positive correlation) and blue represented low adjacency (negative correlation).
Abbreviations: GS, gene significance; MM, module membership; WGCNA, Weighted Gene Expression Network Analysis.
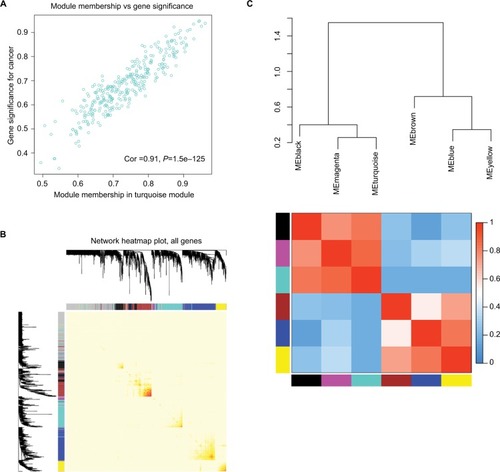
Figure 8 PPI network of genes in the top three modules.
Notes: The turquoise nodes represent the genes in turquoise module. The black nodes represent the genes in black module. The brown nodes represent the genes in brown module. Red words represent upregulated genes and blue words represent downregulated genes. The network was constructed using Cytoscape 3.4 software. Abbreviation: PPI, protein–protein interaction.
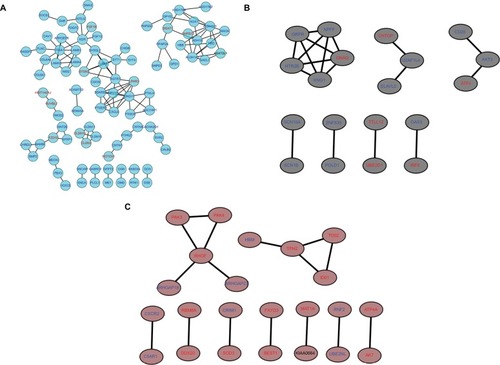
Figure 9 GO and KEGG enrichment analysis of three genes modules.
Note: (A) GO analysis of turquoise module; (B) GO analysis of black module; (C) GO analysis of brown module; (D) KEGG analysis of turquoise module; (E) KEGG analysis of black module; (F) KEGG analysis of brown module.Abbreviations: GO, gene ontology; KEGG, Kyoto Encyclopedia of Genes and Genomes.
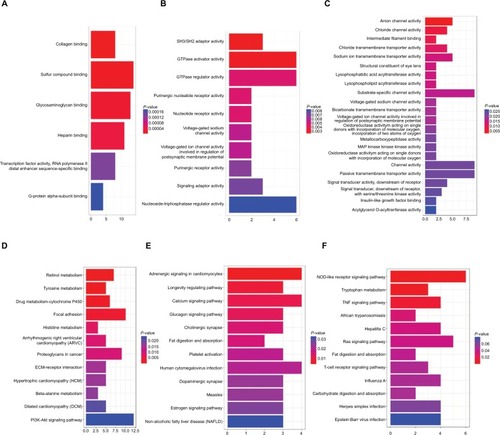
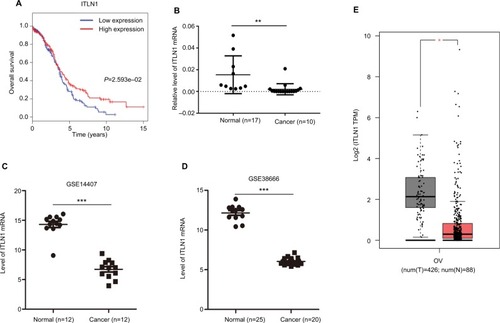
Figure 10 Validation of hub genes.
Notes: (A) Survival analysis indicated that ITLN1 was a positive prognosis factor in epithelial ovarian cancer, while patients with a higher expression of ITLN1 had significantly longer overall survival compared to those with higher expression (P=2.593e–02). (B) ITLN1 validation using qRT-PCR analysis. (C, D) Validation of ITLN1 expression from the GEO databases. Two datasets showed lower expression of ITLN1 in epithelial ovarian cancer tissues compared with normal ovarian tissues (P<0.001). (E) Validation of ITLN1 expression in GEPIA. Lower expression of ITLN1 in tumor tissues compared with normal ovarian tissues. ***P<0.001; **P<0.01; *P<0.05.
Abbreviations: GEO, Gene Expression Omnibus; GEPIA, Gene Expression Profiling Interactive Analysis; num(T), number of tumor sample, num(N), number of normal sample; OV, ovarian cancer; qRT-PCR, quantitative real-time RT-PCR.