Figures & data
Figure 1 HPLC chromatograms of (A) HCEE and (B) coronarin-D methyl ether standard (Rt=4.12 minutes) and coronarin-D (Rt=5.42 minutes).
Abbreviations: AU, area units; HCEE, Hedychium coronarium ethanol extract.
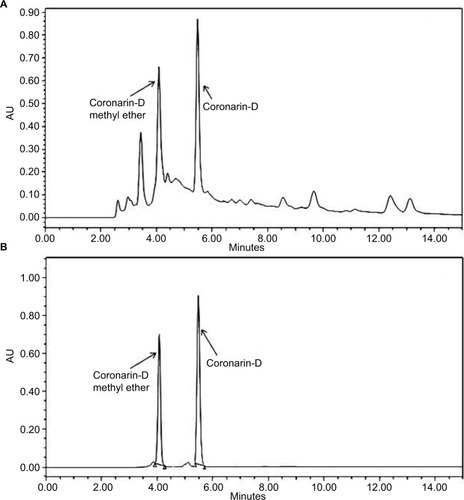
Table 1 IC50 values (expressed as μg/mL) in tested cancer (A549, HeLa, PANC-1, LnCaP, Jurkat) and normal (HUVEC) cell lines treated with the investigated samples: HCEE and positive control camphothecin
Figure 2 Effect of HCEE on the clonogenic survival of cervical cancer HeLa cells.
Notes: (A) HeLa cells were seeded on six-well plates and incubated overnight. Then the cells were treated with 0, 20, and 40 μg/mL of HCEE for 48 hours. After incubation for 7 days, the colonies were stained with methylene blue after which they were fixed with methanol and imaged under a microscope. (B) Representative histograms are expressed as survival fraction and represent the mean ± SD of three different experiments (n=3). **P<0.01 and ***P<0.001 denotes statistically significant difference between the control and treated groups.
Abbreviation: HCEE, Hedychium coronarium ethanol extract.
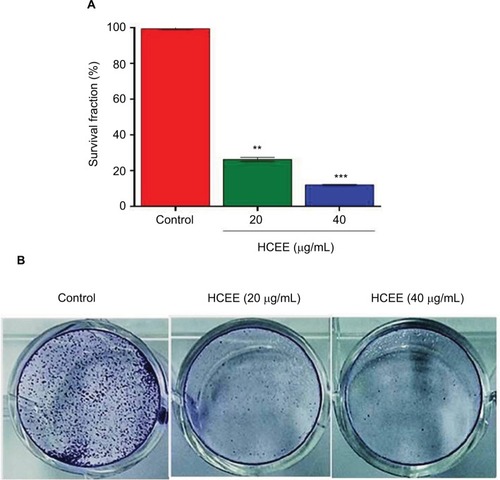
Figure 3 Effect of HCEE-induced cell apoptosis in HeLa cells.
Notes: (A) Fluorescent assay of Hoechst 33342 staining. HeLa cells were treated with different concentrations (0, 20, and 40 μg/mL) of HCEE, followed by staining with Hoechst 33342 staining solution and visualization under a fluorescent microscope. (B) Flow cytometry analysis of cell apoptotic rates using Annexin V-FITC/PI double labeling. (C) The percentage of live, early apoptotic, late apoptotic, and necrotic cells at different concentrations (0–40 μg/mL) of HCEE. Data are mean ± SD from three individual experiments.
Abbreviations: FITC, fluorescein isothiocyanate; HCEE, Hedychium coronarium ethanol extract; PI, propidium iodide.
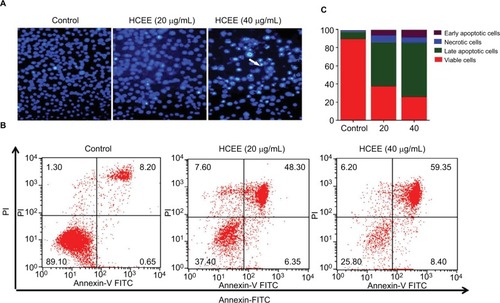
Figure 4 Effect of HCEE on DNA fragmentation in HeLa cells as measured by TUNEL assay.
Notes: HeLa cells were incubated for 24 hours with various concentration of HCEE (0–40 μg/mL). They were then treated with DNA labeling solution containing terminal deoxynucleotidyl transferase enzyme and fluorescein-conjugated dUTP and further incubated in PI/RNase staining buffer and kept under dark before analyzing by flow cytometry. Representative dot plot image shows the fluorescence shift toward the left, thereby indicating the increase in TUNEL-positive cells.
Abbreviations: dUTP, deoxyuridine triphosphate; FITC, fluorescein isothiocyanate; HCEE, Hedychium coronarium ethanol extract; PI, propidium iodide.
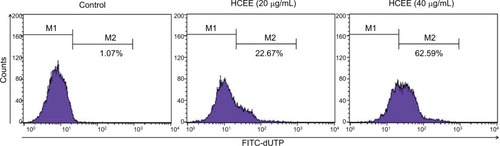
Figure 5 Effect of cell cycle distribution of HeLa cells exposed to different concentrations of HCEE (0–40 μg/mL) for 24 hours.
Notes: (A) Flow cytometric analysis of cell cycle with PI DNA staining. (B) The percentage of cell cycle distribution in different phases of cell cycle. Data are represented as mean ± SD of three independent experiments. The significant differences in treated cells and the control group are shown by ***P<0.001.
Abbreviations: HCEE, Hedychium coronarium ethanol extract; PI, propidium iodide.
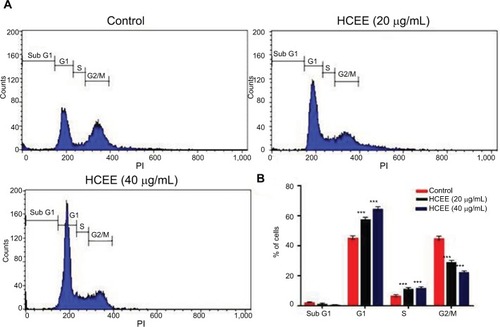
Figure 6 Effect of HCEE on ROS generation in HeLa cells.
Notes: (A) HeLa cells were treated with control, 20 and 40 µg/mL of HCEE and stained with DCFH-DA. Then they were subjected to flow cytometry. (B) Histogram of mean fluorescence intensity of DCFH-DA–stained HeLa cells exposed to control and various concentrations of HCEE (20 and 40 µg/mL). Each value represents mean ± SD (n=3). ***P<0.001 compared with control. (C) HeLa cells were treated with 20 μg/mL of HCEE in the presence or absence of 10 mM NAC for 24 hours. Cell viability was measured using MTT assay and the results are represented as mean ± SD (n=3). ***P<0.001 vs control group.
Abbreviations: DCFH-DA, 2′,7′-dichlorodihydrofluorescein diacetate; HCEE, Hedychium coronarium ethanol extract; NAC, N-acetyl-l-cysteine.
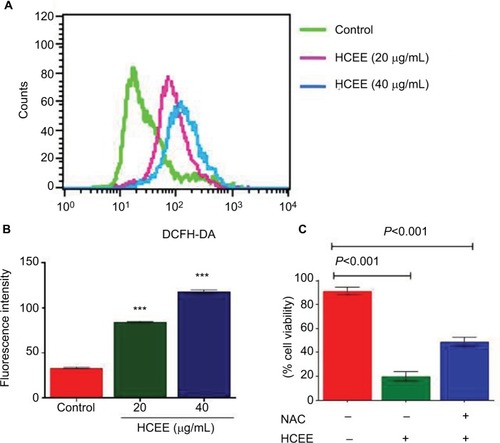
Figure 7 Mitochondrial membrane potential of HeLa cells treated with HCEE as determined by JC-1 fluorescent dye.
Notes: (A) Representative images of JC-1 staining in HeLa cells treated with different concentrations of HCEE (0–40 μg/mL). After 24 hours, the cells were stained with JC-1 probe and imaged under fluorescence microscope, which showed loss of red fluorescence (aggregate) and abundance of green fluorescence (monomers), thereby indicating depolarization of mitochondrial membrane potential. (B) Evaluation of mitochondrial membrane potential in HeLa cells by flow cytometry. (C) Quantification of mitochondrial membrane potential (% of control) was expressed as JC-1 ratio (aggregate:monomer). Data represent mean ± SD of three replicates. **P<0.01, ***P<0.001 vs control group.
Abbreviation: HCEE, Hedychium coronarium ethanol extract.

Figure 8 Effect of HCEE on activation of caspases.
Notes: (A) Flow cytometry analysis of active caspase-3, caspase-8, and caspase-9 in HeLa cells. (B) Quantitative analysis of apoptotic cell population for active caspase-3, caspase-8, and caspase-9. Data are represented as mean ± SD values of three experiments. ***P<0.001 compared with untreated control group.
Abbreviations: FITC, fluorescein isothiocyanate; HCEE, Hedychium coronarium ethanol extract.
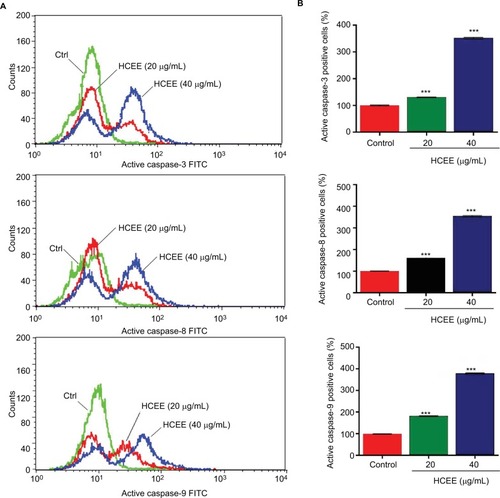
Figure 9 Effect of HCEE on HeLa cells’ migration and invasion in vitro.
Notes: (A) Representative images of HeLa cell invasion treated with HCEE and examined by the Transwell invasion assay. Magnification 10×. (B) Quantitative analysis of percent of cell invasion in HCEE-treated cells compared to the control. Data are representative of three replicates and are expressed as mean ± SD. ***P<0.001 compared with control group. (C) Wound closure ability of treated HeLa cells after creation of scratch wound in control and treated wells. The images of wounded extract-treated HeLa cell monolayers captured using a phase-contrast microscope at different time intervals (0, 24, and 48 hours) after the scratch are shown. Magnification 10×. (D) Migration rates were quantitatively analyzed by calculating the difference between wound widths of HCEE-treated and control cells at 0, 24, and 48 hours. Results are expressed as percentage of cell migration. (E) MMP activity by gelatin zymography assay. (F) Quantification of gelatin zymography data for MMP-2 and MMP-9. Data were presented as mean ± SD for three independent experiments. **P<0.01, ***P<0.001 compared with control group. Data are presented as mean ± SD for three independent experiments. **P<0.01, ***P<0.001 compared with control group.
Abbreviation: HCEE, Hedychium coronarium ethanol extract.
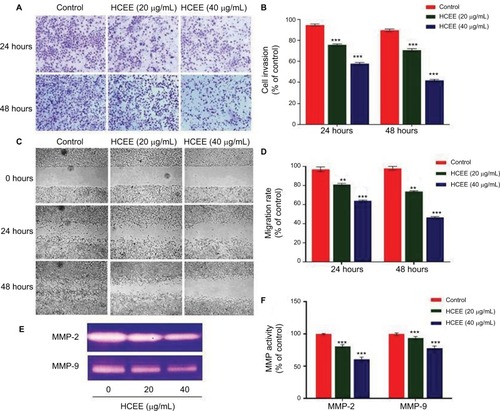
Figure 10 Western blot analysis. Cells treated with HCEE were lysed for Western blot analysis with antibodies against (A) apoptosis, (B) cell cycle and (C) cell migration and invasion proteins. (D–F) Densitometry analysis of proteins performed using ImageJ software.
Notes: β-actin was used as a reference gene. The blots represent one typical result from three independent experiments. **P<0.01 and ***P<0.001 were considered statistically significant differences between the control and treated groups.
Abbreviation: HCEE, Hedychium coronarium ethanol extract.
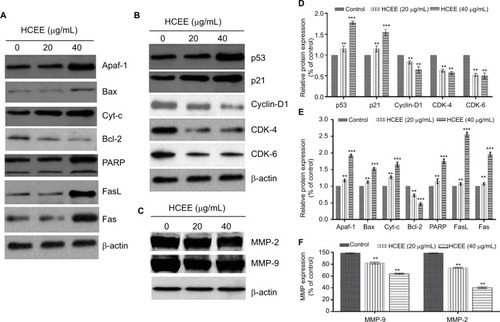
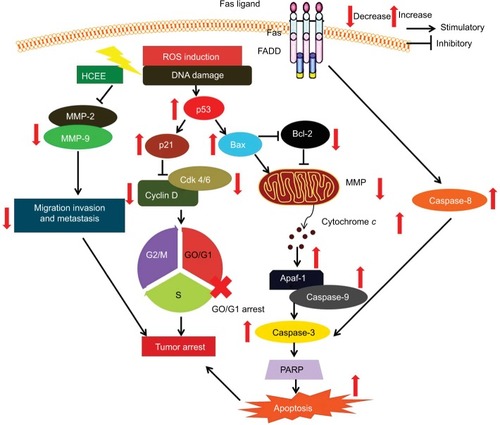
Figure 11 Schematic representation showing the effect of HCEE on HeLa cancer cells by inducing apoptosis, promoting cell cycle arrest, and inhibiting cell migration and invasion.
Abbreviation: HCEE, Hedychium coronarium ethanol extract.