
Figures & data
Figure 1 Flow diagram of included studies for this meta-analysis.
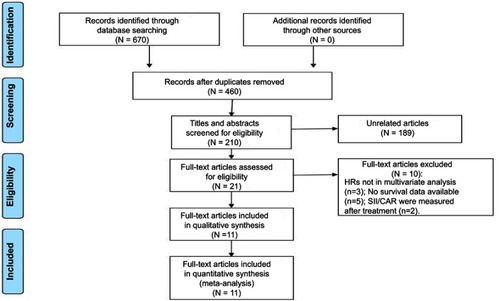
Figure 2 Quality assessment of 12 cohort studies included in the meta-analysis according to predefined eight items.
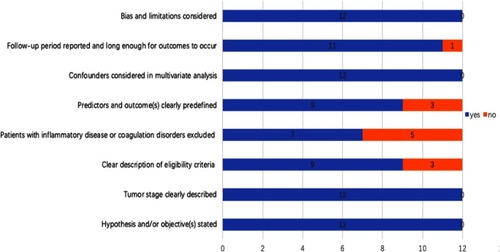
Table 1 Main characteristics of all included studies
Figure 3 Meta-analysis of the correlation between SII and OS.
Abbreviations: OS, overall survival; SII, systemic immune-inflammation index; HR, hazard ratio; 95%CI, 95% confidence interval.
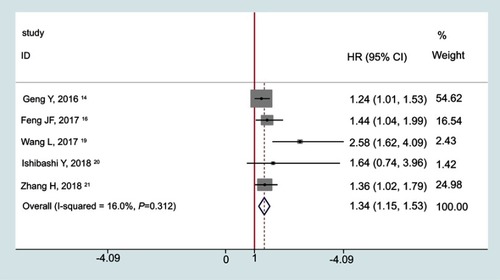
Table 2 Subgroup analysis of the correlation between SII and OS
Figure 4 Meta-analysis of the relationship between SII and clinical pathology in EC patients: A) histological grade; B) infiltration depth; C) lymph node metastasis; D) clinical stage.
Abbreviations: SII, systemic immune-inflammation index; EC, esophageal cancer; OR, odds ratio; 95%CI, 95% confidence interval.
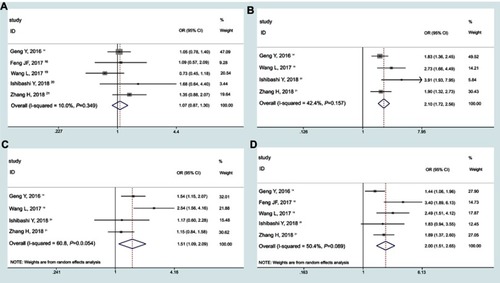
Figure 5 Meta-analysis of the correlation between CAR and OS.
Abbreviations: OS, overall survival; CAR, C-reactive protein-to-albumin ratio; HR, hazard ratio; 95%CI, 95% confidence interval.
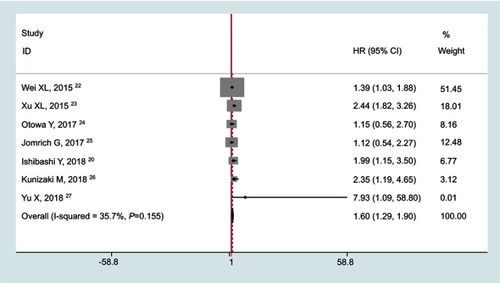
Table 3 Subgroup analysis of the correlation between CAR and OS
Figure 6 Meta-analysis of the relationship between CAR and clinical pathology in EC patients: (A) histological grade; (B) infiltration depth; (C) lymph node metastasis; (D) clinical stage.
Abbreviations: CAR, C-reactive protein-to-albumin ratio; EC, esophageal cancer; OR, odds ratio; 95%CI, 95% confidence interval.
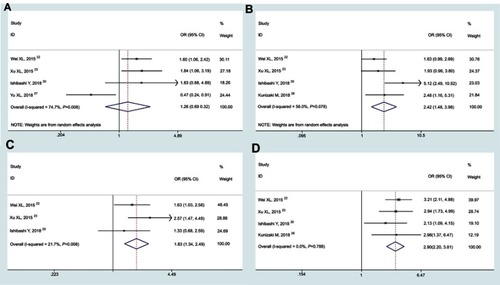
Figure 7 Publication bias assessment for OS with SII (A) and CAR (B).
Abbreviations: OS, overall survival; SII, systemic immune-inflammation index; CAR, C-reactive protein-to-albumin ratio.
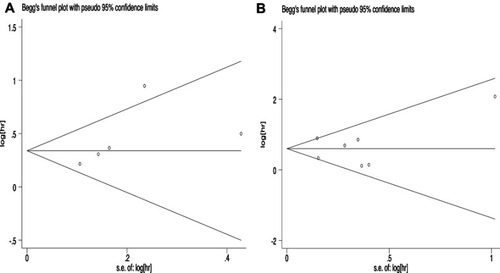
Figure 8 Sensitivity analysis for OS in SII (A) and CAR (B).
Abbreviations: OS, overall survival; SII, systemic immune-inflammation index; CAR, C-reactive protein-to-albumin ratio.
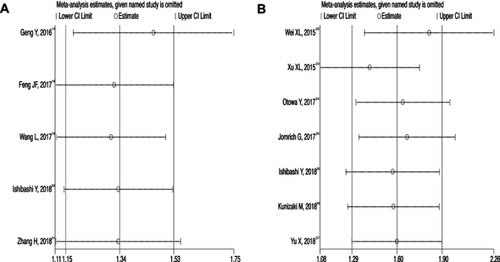
Figure S1 Risk of bias assessment for SII.
Abbreviations: SII, systemic immune-inflammation index.
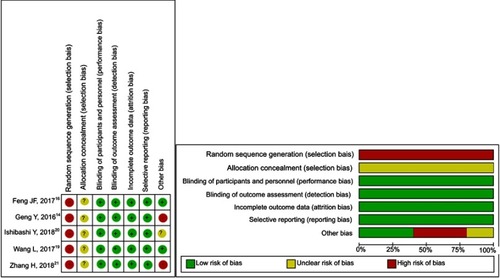
Figure S2 Risk of bias assessment for CAR.
Abbreviations: CAR, C-reactive protein-to-albumin ratio.
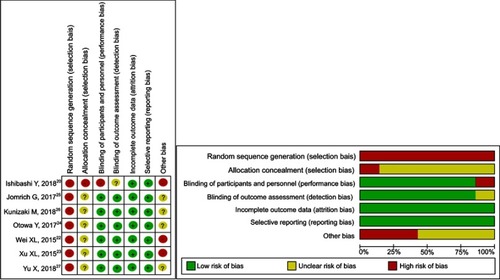
Table S1 Relevant data of clinicopathologic characteristics for SII and CAR in EC patients
Table S2 Study quality of all included cohort studies in the meta-analysis