
Figures & data
Figure 1 Bimodal treatment plan with IMRT (1) and CIRT (2) for patient 20 with a T4 ACC of the right lacrimal gland.
Notes: Native planning CT (A), matched contrast-enhanced planning MRI (B), and coronal reconstruction of the planning CT (C) are depicted from top to bottom. The CTV is delineated in yellow and the PTV in a blue line.
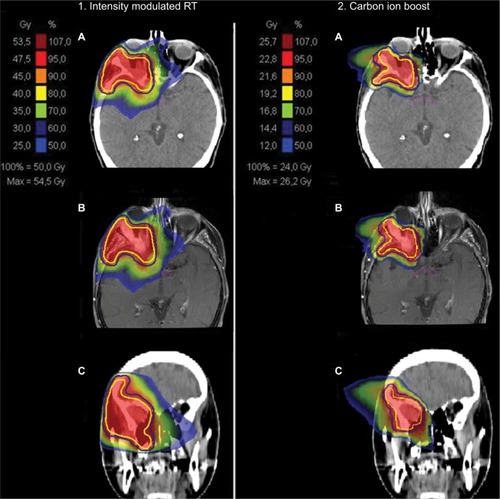
Figure 2 MRI before RT start in patient 20.
Notes: In the initial MRI before RT start, you can see an ACC of the right lacrimal gland that infiltrates the right lateral medius muscle and shows perineural spread into the right cavernous sinus. Already at 3 months after primary bimodal RT, PR was diagnosed in the follow-up MRI.
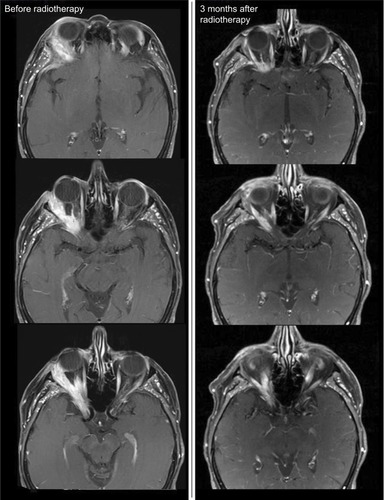
Table 1 Patient, tumor, and treatment characteristics
Figure 3 Kaplan–Meier survival curves.
Note: (A) LC (median 24 months, range 6–59 months), OS (median 36 months, range 9–102 months), and DPFS (median 31 months, range 6–102 months) for all patients; (B) LC (median 24 months, range 6–59 months), OS (median 31 months, range 11–102 months), and DPFS (median 31 months, range 6–102 months) for ACC patients only.
Abbreviation: DPFS, distant progression-free survival.
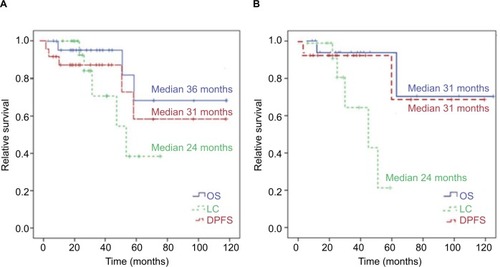
Figure 4 Kaplan–Meier curves for LC differed in dependence of histology.
Notes: Estimated 2-year and 5-year LC for ACC of 80% vs 100% and 21% vs 100% compared with other histology (HR 43.0, 95% CI 0.5–107.8; P=0.09).
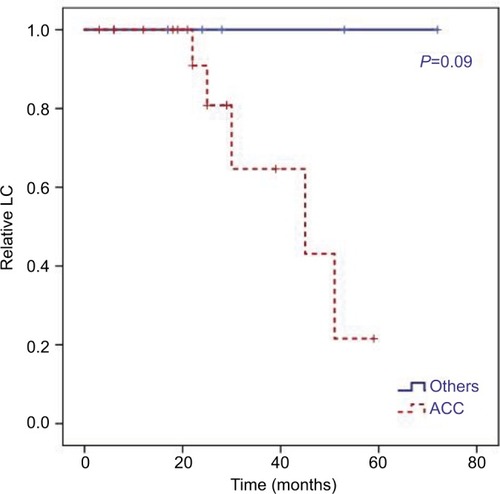
Figure 5 Kaplan–Meier curves.
Notes: LC for ACC patients only dependent on presence of macroscopic tumor in planning CT and MRI scans before RT (R2 resection + definitive RT). In univariate analysis, we identified a macroscopic tumor before RT as a significant negative prognostic factor for these patients (HR 0.04, 95% CI 0–761.22; P=0.026).
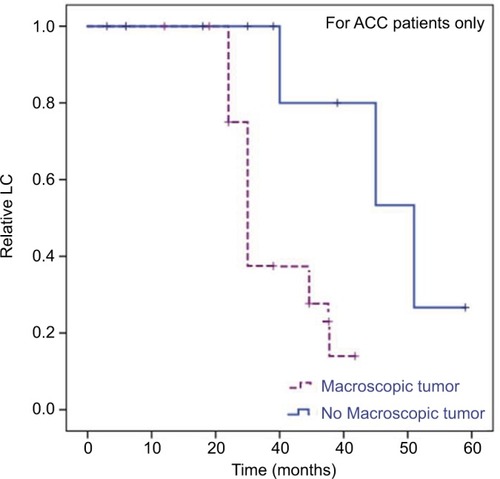
Table 2 Treatment results
Table 3 Treatment-related acute and late toxicity (n=24)