
Figures & data
Table 1 Characteristics of patients
Figure 1 Stratification of patients according to the LND cutoff points obtained using the median method, the X-tile program, the survival-tree algorithm, and the time-dependent ROC curve analysis.
Note: (A) 0.44 as the LND cutoff point, (B) 0.65 as the LND cutoff point, and (C) 0.64 as the LND cutoff point.
Abbreviations: LND, lymph node density; ROC, receiver operating characteristic.
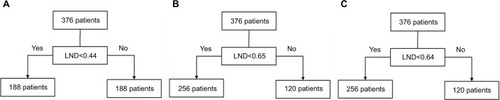
Figure 2 Kaplan–Meier curve for evaluating the overall survival of children defined by different LND cutoff points.
Notes: (A) <0.44 (blue line) vs ≥0.44 (green line), (B) <0.65 (yellow line) vs ≥0.65 (purple line), (C) <0.64 (orange line) vs ≥0.64 (red line), and (D) synthetic diagram of all the survival curves.
Abbreviation: LND, lymph node density.
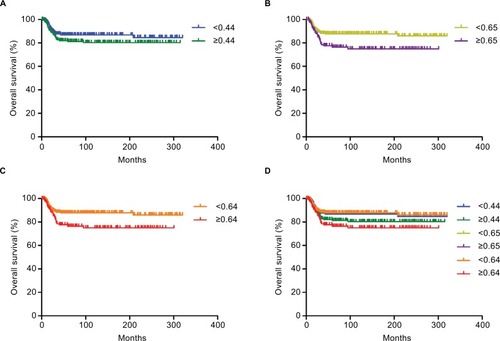
Figure 3 Smooth curve fitting of the risk of mortality and LND after adjusting variables including race, SEER stage, and tumor laterality.
Note: The red line represents the fitting curve, and the blue dotted lines represent the 95% CI.
Abbreviation: LND, lymph node density; SEER, Surveillance, Epidemiology, and End Results.
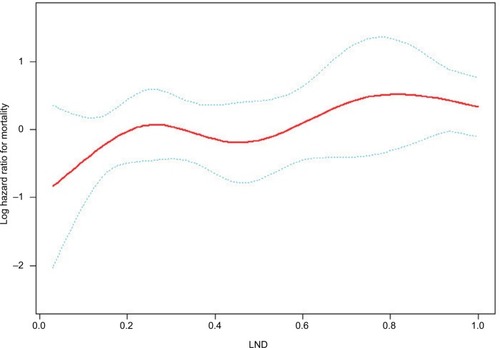
Table 2 Univariate and multivariate analyses of overall survival