Figures & data
Figure 1 TINAGL1 is upregulated in HCC samples and HCC cell lines.
Notes: (A and B) TINAGL1 mRNA levels in the HCC and non-cancerous tissues showing upregulation in 31/38 (81.6%) of the HCC tissues. (C) Western blots showing TINAGL1 protein levels in four randomly selected tissue pairs, normalized to GAPDH. (D) TINAGL1 mRNA levels in seven HCC cell lines were higher than those in L02 cells. *P<0.05; **P<0.01; ***P<0.001.
Abbreviation: HCC, hepatocellular carcinoma.
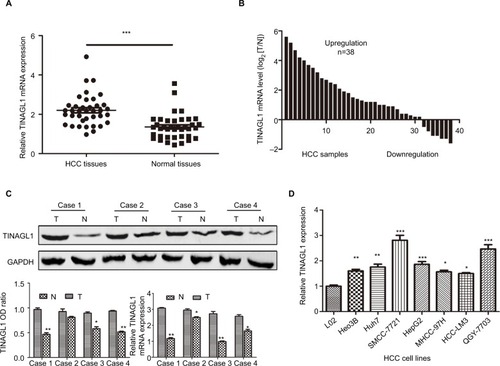
Figure 2 TINAGL1 is a biomarker of HCC and associated with poor prognosis.
Notes: Kaplan–Meier curves showing OS (A) and PFS (B) of TINGL1high and TINAGl1low HCC patients. (C) Forest plot showing that TINAGL1 overexpression is an independent prognostic factor for OS.
Abbreviations: HCC, hepatocellular carcinoma; OS, overall survival; PFS, progression-free survival.
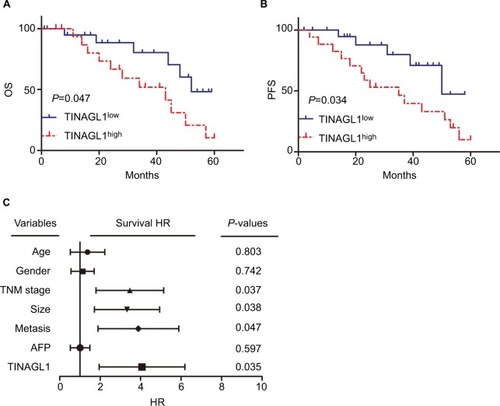
Table 1 The association between TINAGL1 and clinical characteristics in HCC tissues
Figure 3 TINAGL1 promotes HCC cell survival.
Notes: (A and B) RT-PCR and Western blot showing TINAGL1 mRNA and protein levels in HCC cells transfected with si-TINAGL1 or TINAGL1. (C and D) The proliferation and colony formation rates of the transfected cells. (E) Migration and invasion of the transfected cells as demonstrated by the transwell assay; bar =50 µm. (F) EdU uptake (red) in cells counterstained with Hoechst (blue); bar =200 µm. (G) Annexin V/PI stained cells showing apoptosis rates. *P<0.05; **P<0.01; ***P<0.001.
Abbreviations: EdU, 5-ethynyl-2′-deoxyuridine; HCC, hepatocellular carcinoma; PI, propidium iodide; RT-PCR, reverse transcription polymerase chain reaction.
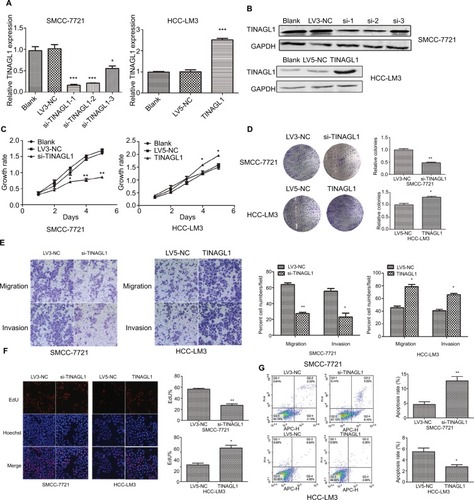
Figure 4 Effect of TINAGL1 on the growth of tumor in nude mice.
Notes: (A) Tumor masses in the different mouse groups. (B) In vivo fluorescence imaging of tumors 1, 2, 3, and 4 weeks after inoculation. (C and D) Tumor volume and weight in different mouse groups. (E) Western blots showing TINAGL1 expression in the tumor tissues of different groups. **P<0.01.
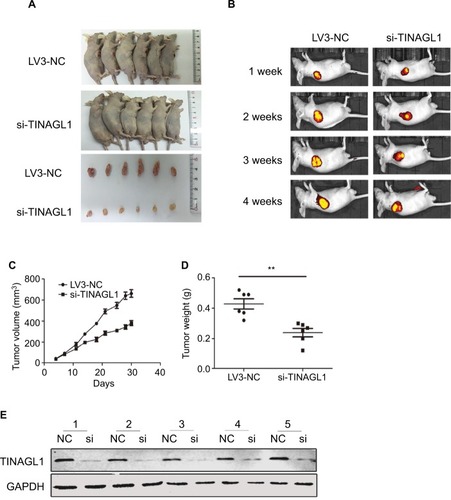
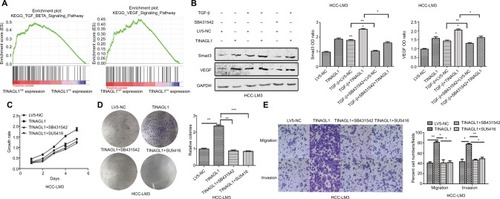
Figure 5 TINAGL1 promotes HCC cell proliferation and migration via the TGF-β/Smad3/VEGF axis.
Notes: (A) GSEA results showing significant enrichment of the TGF-β and VEGF signaling pathways in the TINAGL1high patients from the TCGA liver cancer cohort. (B) Western blots showing Smad3 and VEGF levels in HCC cells in response to TGF-β, TINAGL1, and SB431542 (Smad3 inhibitor). (C–E) Functional assays on TINAGL1-overexpressing HCC-LM3 cells treated with SB431532 and SU5416 (VEGF inhibitor); bar =50 µm. *P<0.05; **P<0.01; ***P<0.001.
Abbreviations: HCC, hepatocellular carcinoma; GSEA, gene set enrichment analysis; TCGA, The Cancer Genome Atlas.