
Figures & data
Figure 1 iTRAQ-based LC-MS/MS proteomic strategy to investigate a series of serum proteomes after radical resection. (A) Schematic view of the experimental design and the iTRAQ plex-labeling. Three recurrent HCC patients and 1 non-recurrent HCC patient were recruited and the serum samples of these 4 HCC patients have been collected at the timepoints of 1 month, 3 months, 6 months and 9 months after radical resection. Recurrent patients were referred to as Patients A, B and C and nonrecurrent patient as patient D. After depleting HAPs in the serum sample and protein digestion, the resultant peptide mixture was further labeled with chemicals from the iTRAQ kit. Equal amounts of labeled peptide mixture were then analyzed by 2D LC–MS/MS. (B) A chromatogram of MARS-Human 14 Multiple Affinity Removal System Column-based depletion. (C) SDS-PAGE analysis of serum samples before and after removal of HAP by MARS. LAP-1 and HAP-1 lanes were 5 μg of sample loading, LAP-2, HAP-2 and the serum lane was 10 μg loading. (D) Label-free analysis of 16 serum samples after the removal of HAPs by MARS. The black triangle is the median of protein concentration and the residual HAPs are marked as colored shapes.
Abbreviations: iTRAQ, isobaric tags for relative and absolute quantitation; LC-MS/MS, multidimensional liquid chromatography-tandem mass spectrometry; HCC, hepatocellular carcinoma; HAPs, high abundance proteins; LAP, low abundance protein.
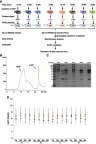
Figure 2 The characteristics of serum proteome. (A) 690 proteins were identified in groups of Patient A/B and 687 proteins in groups of Patient C/D; meanwhile, 546 proteins were identified in both groups. (B) IPs of total 831 serum proteins. IPs were uniformly distributed with the fraction of acidic proteins slightly more abundant than that of alkaline proteins. (C) The molecular weights of 831 serum proteins. The cell components (D) and the biological processes (E) of all identified proteins were analyzed by GO annotation. (F) The abundances of all proteins identified in 16 serum proteomes.
Abbreviations: IP, isoelectric point; GO, Gene Ontology.
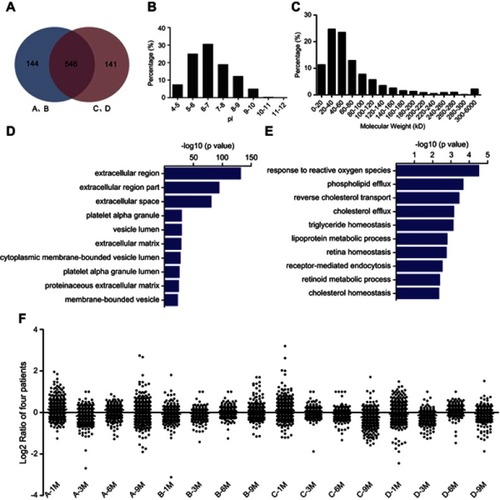
Figure 3 GO and IPA analyses of differentially abundant proteins. The GO annotation of these 27 identified DAPs based on the involved biological processes (A), molecular functions (B), associated disease and disorders (C) and involved molecular pathways (D). IPA of the interaction networks and signaling pathways of these 27 DAPs. The results indicated that the ERK1/2 (E) and NF-κB (F) signaling pathways were involved in the early recurrence of HCC. The red labeling indicates the upregulated proteins and green labeling indicates the downregulated proteins. Solid line shows direct interaction and dotted line shows indirect interaction.
Abbreviations: GO, Gene Ontology; IPA, ingenuity pathway analysis; DAP, differentially abundant protein; NF-κB, nuclear factor-κB; HCC, hepatocellular carcinoma.
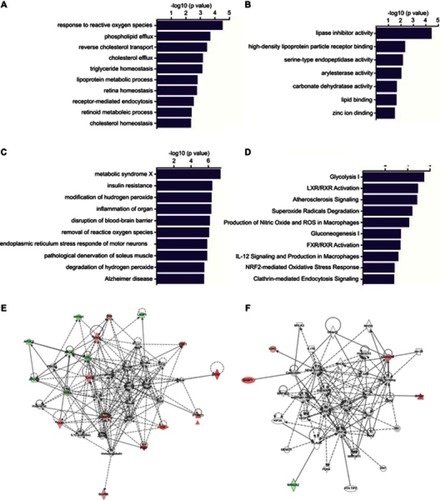
Figure 4 The prognostic value of PGK1 in HCC recurrence. Twenty-seven DAPs could be divided into four clusters: steady increase from 3 to 9 M (A), steady increase from 3 to 6 M then sharp increase from 6 to 9 M (B), sharp increase from 3 to 6 M but then sharp decrease from 6 to 9 M (C), and steady decrease from 3 to 9 M (D). The fold change curve of PGK1 was colored in red in the second cluster (B). (E) The prognostic values of PGK1/AFP serum levels and the combination of PGK1/AFP in RFS (log-rank test).
Abbreviations: HCC, hepatocellular carcinoma; DAP, differentially abundant protein; AFP, alpha-fetoprotein; RFS, recurrence-free survival.
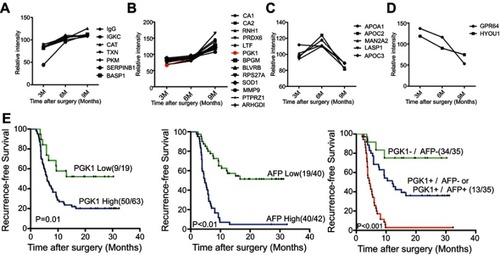
Table 1 Univariate and multivariate logistic regression analysis for risk factors of HCC recurrence
Table S1 The clinicopathologic characteristics of 4 patients with HCC
Table S2 The clinicopathologic characteristics of 82 patients with HCC