Figures & data
Figure 1 Flow diagram of the study selection process.
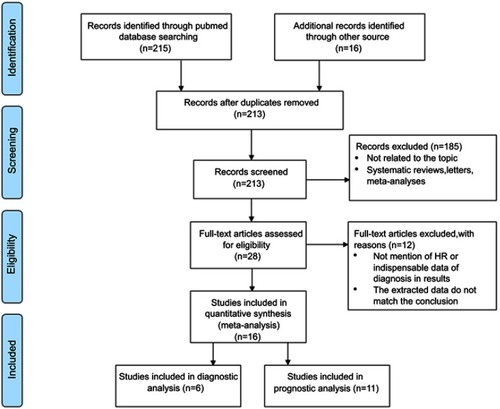
Table 1 Characteristics of the studies included for diagnosis in the meta-analysis
Figure 2 Diagnostic value of miR-371. (A) Forest plots. (B) SROC curve.
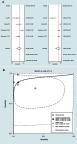
Figure 3 Diagnostic value of miR-373. (A) Forest plots. (B) SROC curve.
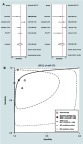
Table 2 Characteristics of the studies included for miR-372 prognosis in tissue
Table 3 Characteristics of the studies included for miR-373 prognosis in the meta-analysis
Figure 4 Forest plot of extracted HR for the association of miR-372 and miR-373 expression with OS/RFS/PFS/DFS.
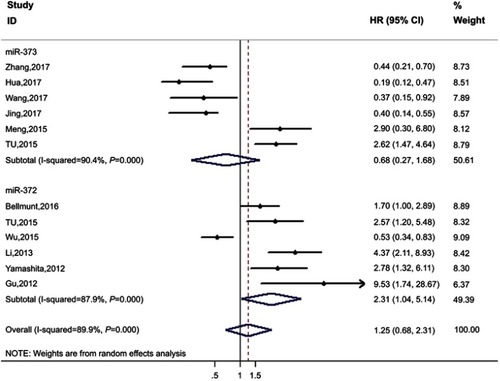
Table 4 The pooled associations between characteristic subgroups of miR-371––3 expression and prognosis of patients
Table S1 Characteristics of studies included in the meta-analysis
Figure 5 Forest plots of the miR-372 according to subgroup. (A) Cutoff value subgroup. (B) Detection method subgroup. (C) Race subgroup.
Figure 5 (Continued).
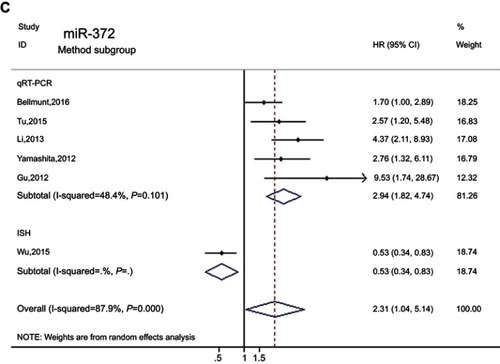
Figure 6 Forest plots of the miR-373 according to subgroup. (A) Cutoff value subgroup. (B) Race subgroup. (C) Sample source subgroup.
Figure 6 (Continued).
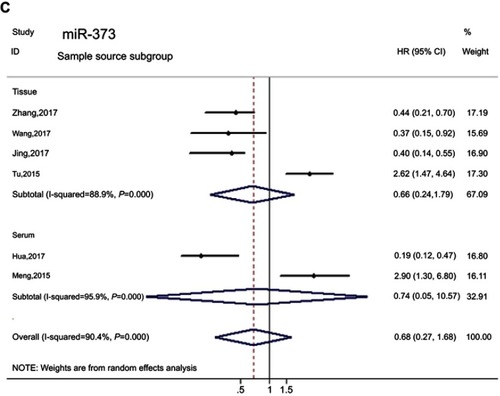
Figure 7 Sensitivity analyses. (A) miR-372. (B) miR-373.
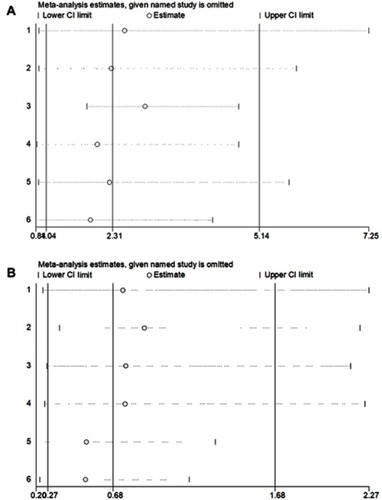
Figure 8 Publication bias analysis. (A) miR-372. (B) miR-373.
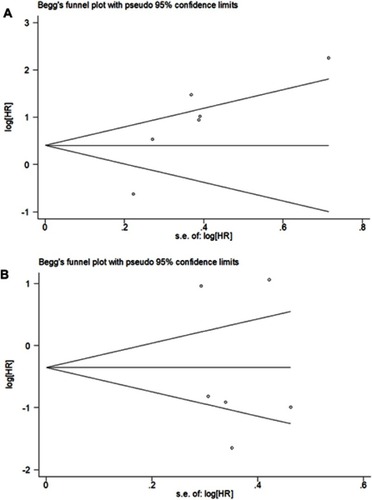
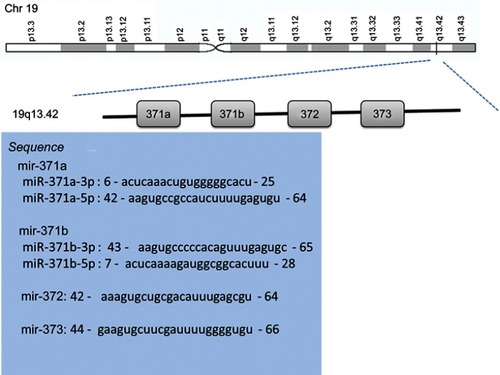
Figure S1 The genomic localization chart and sequences of miR-371-3 cluster.