
Figures & data
Figure 1 miR-17 is upregulated in CRC tumor tissue and implies poor prognosis. (A) The miR-17 expression in the Oncomine database including TCGA Colorectal, Gaedcke Colorectal, Kaiser Colon, Skrzypczak Colorectal, and Hong Colorectal. (B) The relative expression of miR-17 in CRC cancerous tissue (n=51) and adjacent non-tumor tissue (n=50) was measured by quantitative real-time PCR. (C) Kaplan-Meier analysis of the 5-year overall survival rate of patients with high (n=51) and low (n=50) expression of miR-17.
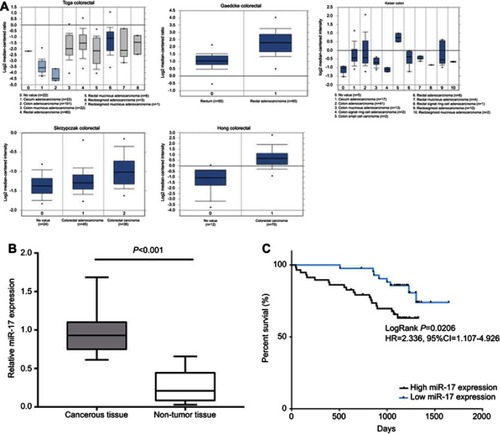
Figure 2 miR-17 is upregulated in tumor cell lines and promotes cell proliferation and invasion in CRC. (A) The expression of miR-17 in three CRC cell lines (HCT116, SW480, and HT29) and in normal colon epithelial cells (FHC). (B) The relative expression of miR-17 was measured by quantitative real-time PCR analysis of HCT116 and SW480 cells transfected with miR-17 mimics and NC for 48 hrs. (C) The cell proliferation rate measured by 24 h CCK-8 assay of SW480 and HCT116 cells transfected with mimic NC, miR-17 mimic, inhibitor NC, and miR-17 inhibitor. (D) Flow cytometry was performed to detect cell apoptotic rate of SW480 and HCT116 cells. (E) Transwell assay was performed to evaluate the invasion of SW480 and HCT116 cells. All values are presented as mean ± SD of three replicates. *P<0.05, **P<0.01, ***P<0.001, compared with FHC cells, mimic NC group, or inhibitors NC group.
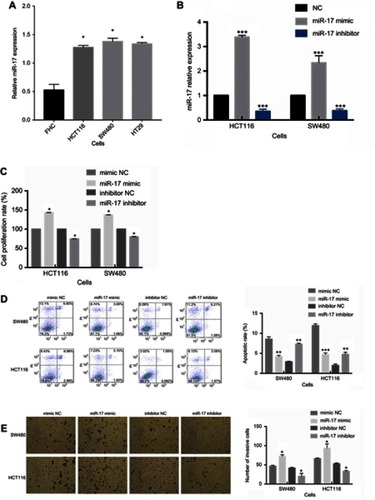
Figure 3 Bioinformatic analysis of gene targets of miR-17. (A) Venn chart of common genes from 3 publicly available databases, including TargetScan, miRWalk, and miRTarbase. (B) The analysis of 8 possible target genes from TCGA database and the human protein atlas database. (C) Analysis of OS based on SIK1 expression from the human protein atlas database.
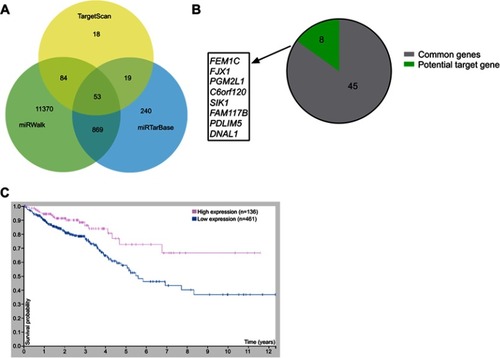
Figure 4 SIK1 may be a direct target of miR-17. (A) The potential binding sequences of SIK1 3ʹUTR and miR-17 based on bioinformatics analysis. The wild-type (WT) and mutated binding sequences are shown. Quantitative real-time PCR analysis (B) and Western blot analysis (C) of SIK1 mRNA and protein in SW480 and HCT116 cells transfected with mimic NC, miR-17 NC, inhibitor NC, and miR-17 inhibitor NC. Relative luciferase activity in SW480 (D) and HCT116 (E) cells transfected with reporter vector containing WT binding sequence (psiCheck-SIK1-3ʹUTR-WT) or mutated binding sequence (psiCheck-SIK1-3ʹUTR-mut) along with miR-17 mimic and negative control. All values are presented as mean ± SD of three replicates. *P<0.05, **P<0.01, compared with mimic NC group, or inhibitors NC group.
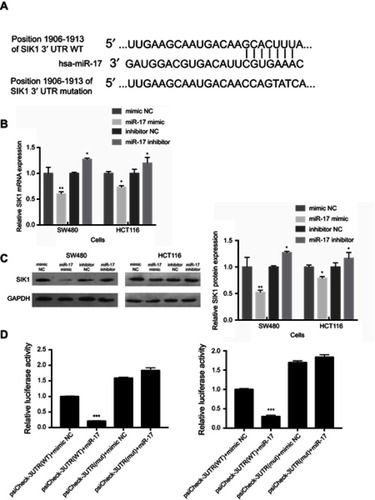
Table 1 The comparison of SIK1 expression in cancerous tissue and adjacent non-tumor tissue
Table 2 Correlations between SIK1 expression and clinical characteristics of patients with CRC
Figure 5 Expression of SIK1 protein in colorectal cancer tissue and adjacent normal tissue by IHC. (A) Weak SIK1 staining in tumor tissue (40x). (B) Weak SIK1 staining in tumor tissue (100x). (C) Weak SIK1 staining in tumor tissue (200x). (D) Strong SIK1 staining in adjacent non-tumor tissue (40x). (E) Strong SIK1 staining in adjacent non-tumor tissue (100x). (F) Strong SIK1 staining in adjacent non-tumor tissue (200x).
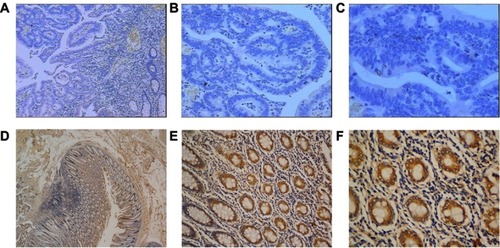
Figure 6 SIK1 is downregulated in colorectal cancer tissue in comparison to adjacent normal tissue. Western blot (A) and quantitative real-time PCR (B) analysis of SIK1 protein and mRNA in surgical specimens. All values are presented as mean ± SD of three replicates. *P<0.05, compared with non-tumor tissue. C, cancerous tissue; ANT, adjacent non-tumor tissue.
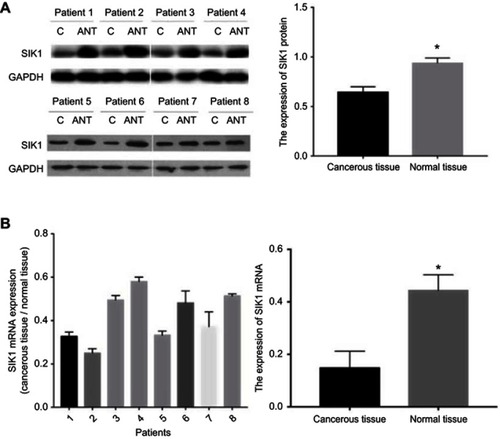
Table 3 Univariate and multivariate survival analysis of patients with colorectal cancer