
Figures & data
Table 1 Comparison of general conditions of the patients in the study and control groups
Table 2 Comparisons of short-term response rates in the study and control groups [n (%)]
Figure 1 Kaplan–Meier plots of overall survival rates in the study and control groups.
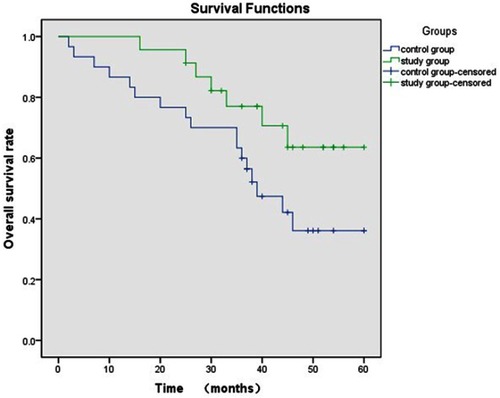
Figure 2 Kaplan–Meier survival curve analysis of progression-free survival in the study and control groups.
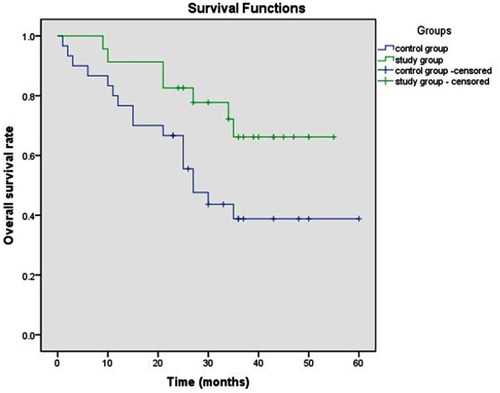
Table 3 Comparisons of acute grade 3 and 4 events in the study and control groups [n (%)]
Table 4 Cox regression model of overall survival
Table 5 Cox regression model of progression-free survival