Figures & data
Table 1 Univariate and multivariate analyses of the clinicopathological characteristics for overall survival in 215 patients with S3-AEG
Figure 1 Receiver operating characteristic curve for the (A) albumin-to-globulin ratio and (B) prognostic nutritional index.
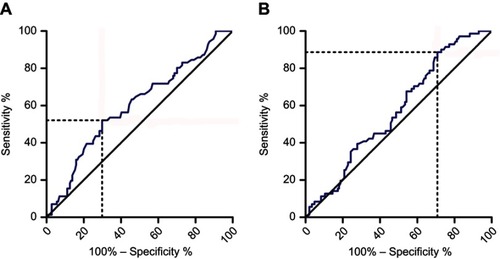
Figure 2 Kaplan-Meier overall survival curves of 5-year survival rates for 215 patients with S3-AEG undergoing curative resection stratified according to the AGR-PNI score. (A) Patients with either stage I, II or III S3-AEG. (B) Patients with stage I or II S3-AEG. (C) Patients with stage III S3-AEG. (D) Stage III S3-AEG patients with an AGR-PNI score of 2, and stage I + II S3-AEG patients with a AGR-PNI score of 0.
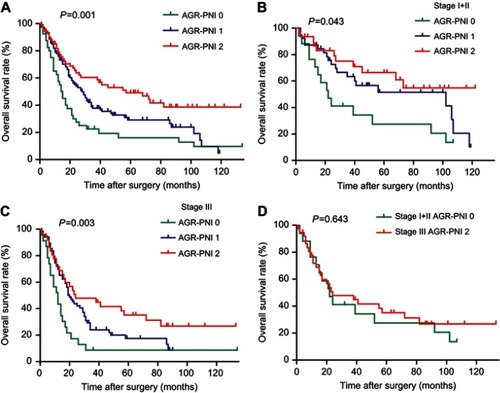
Table 2 Relationships between AGR-PNI and the clinicopathological characteristics of 215 S3-AEG patients
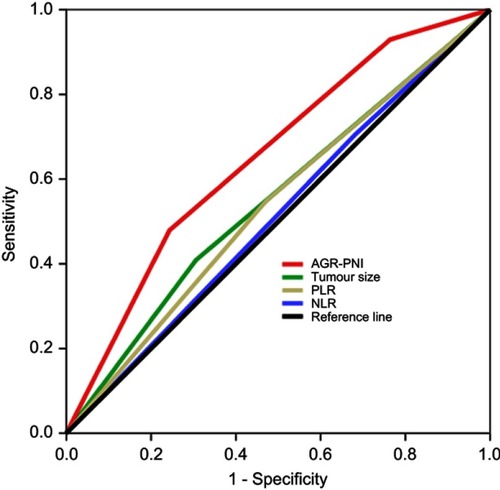
Table 3 Area under the ROC curves of the tumour size and of the NLR, PLR, and AGR-PNI scores
Figure 3 Area under the receiver operating characteristic curves of tumour size and of the NLR, PLR, and AGR-PNI scores.
Abbreviations: AGR, albumin-to-globulin ratio; PNI, prognostic nutritional index; PLR, platelet to lymphocyte ratio; NLR, neutrophil to lymphocyte ratio.