Figures & data
Figure 1 (A) Expression of GDFs in normal brain tissues (n=23) and GBMs (n=81). mRNA expression data was downloaded from GSE4290 dataset and analyzed using GEO2R program. (GDF1 and GDF6 data are not available in GSF4290 dataset). (B), (C) and (D). Expression of GDF10, GDF8/MSTN, and GDF15 in non-tumor tissues (n=23) and GBMs (n=81), respectively. Abbreviations: GBM, gliomablastoma multiforme; MSTN, myostatin.
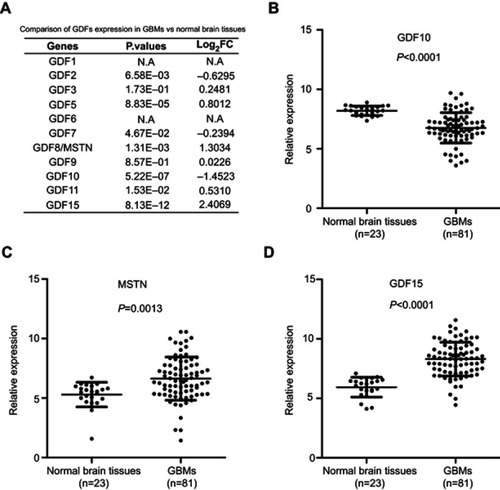
Figure 2 (A) Expression of PD-L1 in normal brain tissues (n=23) and GBMs (n=81). mRNA expression data (Affymetrix Human Genome U133 Plus 2.0 Array) was downloaded from GSE4290 dataset and analyzed using GEO2R program. (B) High PD-L1 expression predicts unfavorable overall survival in TCGA GBMs (n=152). mRNA expression data (RNA-Seq) were downloaded from TCGA GBM dataset. (C) GDFs exhibit differential effects on the expression of programmed death-ligand 1 (PD-L1) in U87 GBM cells. U87 GBM cells were incubated with GDFs (10 ng/mL) for 48 h. β-actin served as a loading control. Fold change indicates the average ratio of quantified blots from three independent experiments. (D) Correlation between GDF15 and PD-L1 expression in TCGA GBM dataset (n=152). Abbreviations: GBM, gliomablastoma multiforme; MSTN, myostatin; TCGA, The Cancer Genome Atlas.
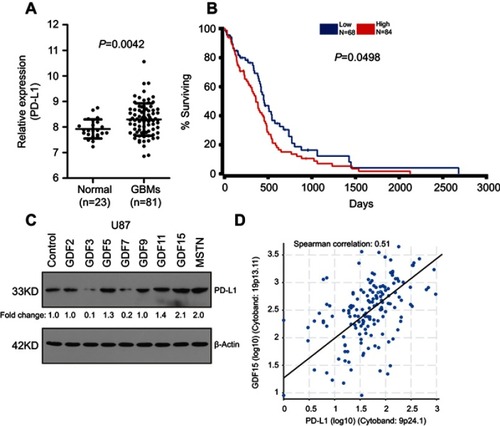
Table 1 Correlation between PD-L1 and GDFs in GBM (TCGA RNA-seq dataset, n=152)
Figure 3 (A) Protein expression of GDF15 and PD-L1 in GBM cell lines. β-actin served as a loading control. (B) GDF15 induced the expression of PD-L1 in U251 and SHG44 GBM cells. GBM cells were transfected with pCMV3-C-FLAG plasmid expressing PD-L1 cDNA ORF or empty vector control for 48 hrs. β-actin served as a loading control. (C) Knockdown of GDF15 by shRNA lentivirus reduced PD-L1 expression in A172 and GIC6 GBM cells. Non-targeting scramble shRNA was used as negative control. Abbreviation: GBM, gliomablastoma multiforme.
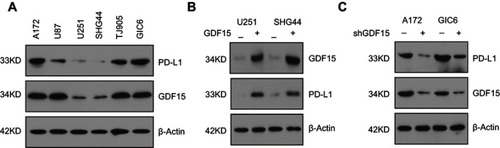
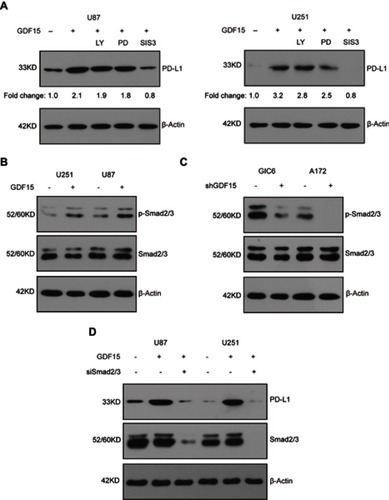
Figure 4 GDF15 regulates PD-L1 expression via the Smad2/3 pathway in GBM cells. (A) U87 and U251 GBM cells were incubated with GDF15 alone (10 ng/mL) or combined with LY (10 µM), PD (10 µM), or SIS3 (1 µM) for 48 h, and then harvested and assessed for PD-L1 by Western blot analysis. Fold change indicates the average ratio of quantified blots from three independent experiments. β-actin served as a loading control. (B) GDF15 activated Smad2/3 signaling in U251 and U87 GBM cells. GBM cells were incubated with GDF15 (10 ng/mL) for 48 h. β-actin served as a loading control. (C) Knockdown of GDF15 by shRNA lentivirus inhibited Smad2/3 signaling in A172 and GIC6 GBM cells. β-actin served as a loading control. (D) Knockdown of Smad2/3 abolished the effect of GDF15 on PD-L1 expression. GBM cells were incubated with GDF15 (10 ng/mL) for 48 h with or without Smad2/3 silencing. β-actin served as a loading control. Abbreviation: GBM, gliomablastoma multiforme.