Figures & data
Figure 1 Pepsinogen C (PGC) expression in HCC and adjacent non-tumor tissues. (A) Representative immunohistochemistry images of high Pepsinogen C (PGC) expression and low PGC expression in HCC and adjacent non-tumor tissues. PGC was expressed predominantly in the cytoplasm. The upper figures were 100× and the down figures were 400×. Scale bar=50 μm. (B) The staining scores of PGC expression between HCC and non-tumor tissues (****P<0.0001). (C) The staining scores of PGC expression between the relapse group and the non-relapse group (****P<0.0001).
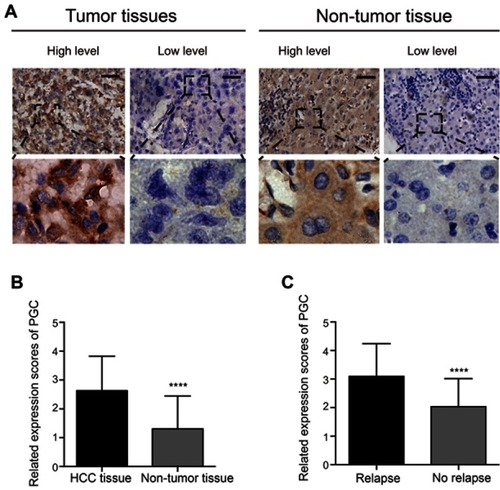
Table 1 Associations between Pepsinogen C expression and clinical characteristics
Figure 2 Overall survival and disease-free survival times of 75 pairs of HCC and adjacent non-tumor tissues using Kaplan–Meier analysis. (A) Overall survival (OS) for Pepsinogen C (PGC) expression (P=0.0004). High PGC expression group showed poor OS than low PGC expression group. (B) Disease-free survival (DFS) for PGC expression (P<0.0001). High PGC level group showed poor DFS than low PGC expression group.
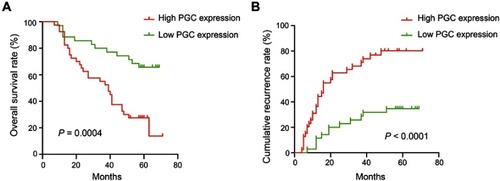
Table 2 Univariate and multivariate analysis of prognostic factors for overall survival and disease-free survival
Figure 3 Kaplan–Meier survival curves according to PGC expression in 75 pairs of HCC and adjacent non-tumor tissues stratified by different tumor size. (A) Overall survival (OS) for PGC expression in patients with large tumor size (≥5 cm) or small tumor size (<5 cm). High PGC expression group showed poor OS than low PGC expression group for large tumor size subgroup (red vs green, P=0.0051); while no significant difference was observed in OS between high PGC expression and low PGC expression group for small tumor size subgroup (yellow vs black, P=0.0842). (B) Disease-free survival (DFS) for PGC expression in patients with large tumor size (≥5 cm) or small tumor size (<5 cm). High PGC level group showed poor DFS than low PGC expression group for large tumor size subgroup (red vs green, P=0.0001); while no significant differences were observed in DFS between high PGC level and low-level group for small tumor size subgroup (yellow vs black, P=0.0660).
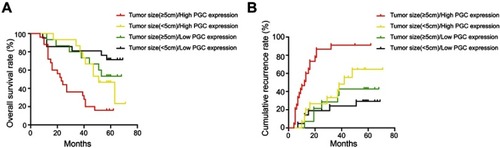
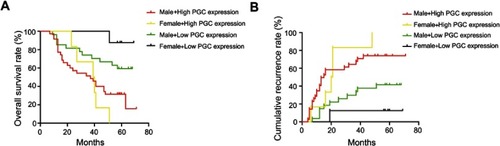
Figure S1 The subgroup analysis of gender and PGC expression level (OS and DFS) using Kaplan–Meier test. (A) The overall survival rate: for the male subgroup, the high PGC level group showed poor OS than the low-level group (red vs green, P=0.0153); meanwhile, for the female subgroup, the similar statistically significant differences were observed in high and low PGC level (yellow vs black, P=0.0002). (B) The disease-free survival rate: for the male subgroup, the high PGC level group showed poor DFS than the low-level group (red vs green, P=0.0031); likewise, for the female subgroup, the similar statistically significant differences were observed in high and low PGC level (yellow vs black, P=0.0016). Red line: male + high PGC level, n=35; green line: male + low PGC, n=27; yellow line: female <5 cm + high PGC, n=0; black line: female, n=3.