Figures & data
Figure 1 PTFs promoted the proliferation, invasion and migration of HCC cells in vitro.
Notes: (A–C) MHCC-97H cells were incubated with DMEM, NFs-CM, CAFs-CM and PTFs-CM for 48 h respectively. Then the cells were subjected to colony-formation assay (A) and transwell assay (B, C). The numbers of cells that formed colons, invaded and migrated were calculated and analyzed. Scale bar, 200 µm. Data are shown as mean ± SD from at least three independent experiments (*P<0.05, **P<0.01).
Abbreviations: CM, conditioned medium; HCC, hepatocellular carcinoma; CAFs, cancer-associated fibroblasts; HCC, hepatocellular carcinoma; NFs, normal fibroblasts; PTFs, peri-tumor fibroblasts.
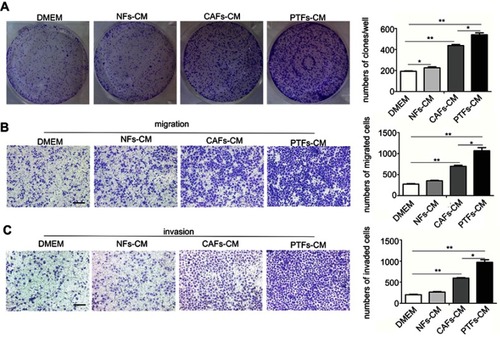
Figure 2 PTFs promoted the progression of HCC mainly by secreting Interleukin 6.
Notes: (A) The profiles of the cytokines secreted from CAFs and PTFs was examined by using the RayBio Human Cytokine Antibody Array. The most significantly increased chemokine IL-6 was marked. (B) Elisa assay was performed to detect the amount of soluble IL-6 in each group. (C) MHCC-97H cells cultured with DMEM containing soluble IL-6 (40 ng/ml) were assessed by transwell assay. (D) IL-6 neutralizing antibody decreased the effect of PTFs-CM on the migration and invasion of MHCC-97H cells. Scale bar, 200 µm. Data are shown as mean ± SD from at least three independent experiments (*P<0.05, **P<0.01, ***P<0.001).
Abbreviations: CAFs, cancer-associated fibroblasts; CM, conditioned medium; HCC, hepatocellular carcinoma; PTFs, peri-tumor fibroblasts.
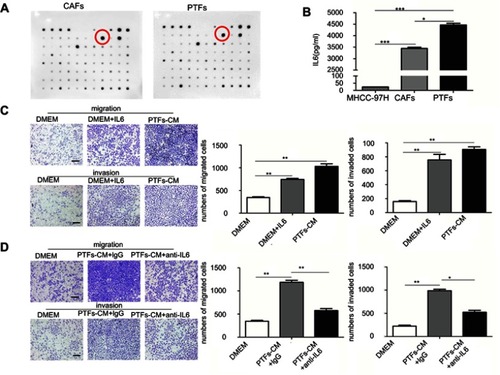
Figure 3 PTFs-derived IL-6 induced the invasion and metastasis of HCC cells through activation of STAT3 signaling.
Notes: (A) MHCC-97H cells were treated with DMEM, NFs-CM, CAFs-CM and PTFs-CM for 48 h respectively. The phosphorylation of STAT3 was detected by Western blot. (B) MHCC-97H cells were incubated with IL-6 (40 ng/ml). (C) IL-6 neutralizing antibody abolished the effect of PTFs on promoting STAT3 phosphorylation (Tyr705) in MHCC-97H cells. (D) MHCC-97H cells cultured in DMEM, PTFs-CM and IL-6 added DMEM were treated with cryptotanshinone, an STAT3 Tyr705 phosphorylation inhibitor, for 24 h. (E+F) Both IL-6- and PTFs-induced migration (E) and invasion (F) abilities of MHCC-97H cells were reduced by cryptotanshinone as assessed by transwell assays. Scale bar 200 µm. Data are shown as mean ± SD from at least three independent experiments (*P<0.05, **P<0.01). (G) MHCC-97H cells transfected with lentiviral plasmid containing STAT3-shRNA (shSTAT3) or vector control (shCtl) were subcutaneously injected into flanks of BALB/c nude mice together with PTFs. MHCC-97H(shCtl) and PTFs were also injected alone. Tumors formed at each group were shown n=3. Black arrow means just injecting MHCC-97H cells, white arrow means PTFs, purple arrow means injecting MHCC-97H(shCtl) with PTFs and red arrow means MHCC-97H(shSTAT3) together with PTFs.
Abbreviations: CM, conditioned medium; HCC, hepatocellular carcinoma; CAFs, cancer-associated fibroblasts; HCC, hepatocellular carcinoma; NFs, normal fibroblasts; PTFs, peri-tumor fibroblasts.
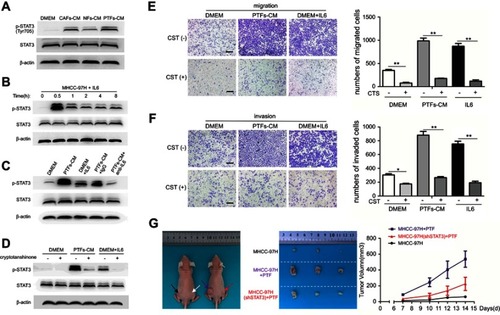
Table 1 Correlation between p-STAT3 expression in HCC peri-tumor issues and clinicopathological parameters (n=88)
Figure 4 Both the levels of IL-6 and p-STAT3(Tyr705) expression are higher in peri-tumor tissues than tumor tissues.
Notes: (A+C) The photograph shows representative tissues with four different levels (negative, weak, moderate, or strong) of immunohistochemical staining intensity of IL-6 and p-STAT3 (Tyr705). Scale bar, 50 µm. (B+D) The expression levels of IL-6 and pTyr705 STAT3 in peri-tumor tissues were higher than those in tumor tissues by immunohistochemistry. (E+F) Analysis of the expression levels of IL-6 and p-STAT3 (Tyr705) in 88 pairs of tumor and adjacent non-tumor tissues by paired t-test.
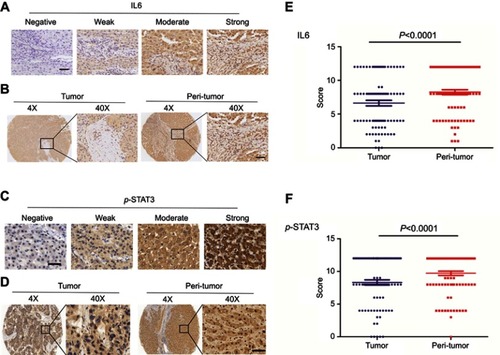
Figure 5 Effects of PTFs on the growth and migration of L-02 cells in vitro.
Notes: (A+B) DMEM and PTFs-CM cultured L-02 cells were assessed by colony forming assay (A) and transwell assay (B) to examine cell proliferation and migration. (C) Western Blot analysis showed that PTFs induced the activation of STAT3 signaling in L-02 cells. Both CTS and IL-6 neutralizing antibody could reduce the effect. (D) L-02 cells were incubated with IL-6 (40 ng/ml). (E+F) L-02 cells cultured in PTFs-CM were treated with CTS or IL-6 neutralizing antibody for 24 h respectively. Then the cells were subjected to colony-forming assay (E) and transwell assay (F). Scale bar, 200 µm. Data are shown as mean ± SD from at least three independent experiments (*P<0.05, **P<0.01, ***P<0.001).
Abbreviations: CM, conditioned medium; CTS, cryptotanshinone; PTFs, peri-tumor fibroblasts.
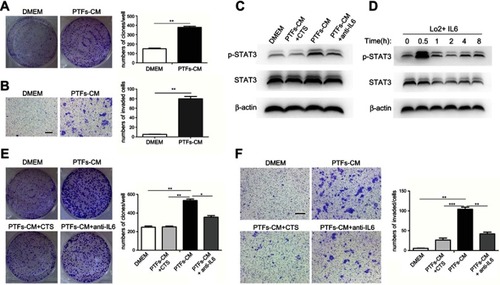
Figure 6 PTFs induced hepatocarcinogenesis through IL-6/p-STAT3 signaling in vivo.
Notes: (A) Non-tumor L-02 cells and PTFs were subcutaneously injected into BALB/c nude mice alone or together. Blue arrow means injecting PTFs; yellow arrow means 104 L-02 cells; red arrow means 104 L-02 cells injected with PTFs; purple arrow means 104 CTS treated L-02 cells injected with PTFs. (B) Tumors formed two weeks after inoculation in each group are shown. Tumor formation was confirmed malignant by H&E staining. Scale bar, 200 µm. n=3.
Abbreviations: CTS, cryptotanshinone; PTFs, peri-tumor fibroblasts.
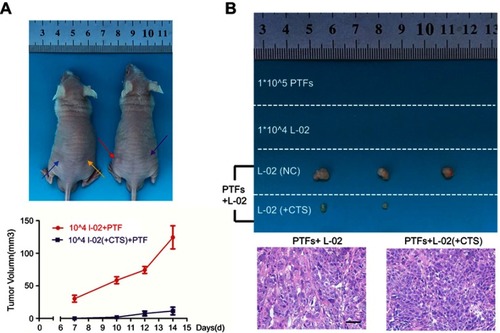
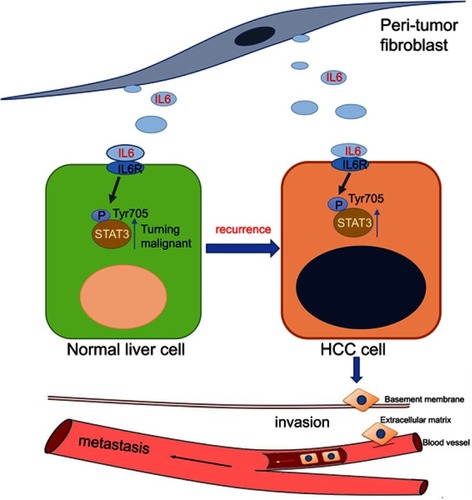
Figure 7 Hypothesis: after surgery, PTFs can stimulate surrounding hepatocytes to transform into a malignant phenotype, leading to hepatocarcinogenesis and tumor recurrence. Then PTFs significantly promote the progression and metastasis of HCC. IL-6/STAT3 signaling pathway plays a critical role in both stages.
Abbreviations: HCC, hepatocellular carcinoma; PTFs, peri-tumor fibroblasts.