
Figures & data
Table 1 Clinical and pathologic characteristics of the 83 study patients
Figure 1 The overall survival rate of GBC patients after GBC radical surgery.
Notes: The Kaplan–Meier curve showed significant differences in the probability of total survival after GBC radical surgery in patients with preoperative fasting hyperglycemia and preoperative fasting normal blood glucose levels. P<0.001 (log-rank test).
Abbreviation: GC, gallbladder carcinoma.
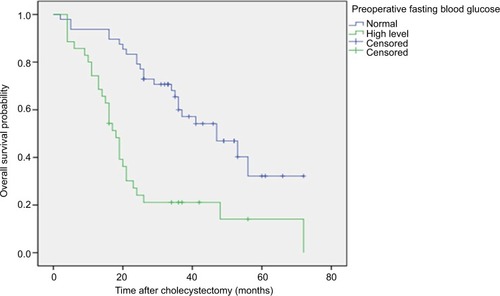
Figure 2 RFS of patients with GBC after GBC radical surgery.
Notes: Kaplan–Meier curves show significant differences in RFS probability after GBC radical surgery in patients with preoperative fasting hyperglycemia and preoperative fasting normal blood glucose levels. P<0.001 (log-rank test).
Abbreviations: GC, gallbladder carcinoma; RFS, recurrence-free survival.
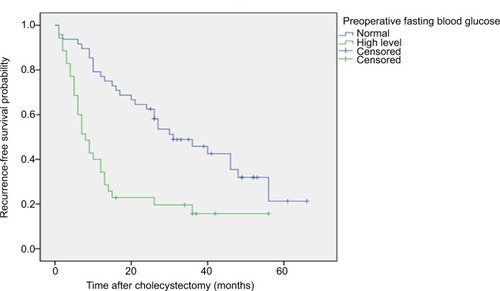
Table 2 Univariate and multivariate analyses of prognostic factors associated with overall survival
Table 3 Univariate and multivariate analyses of prognostic factors associated with RFS