Figures & data
Table 1 Sequences of PCR primers used for RNA analysis
Figure 1 LINC00460 was upregulated and correlated with poor prognosis in CRC.
Notes: (A) Expression of LINC00460 in CRC tissue specimens was determined by a qRT-PCR assay; data are shown as per log2 (2−ΔΔCt) method. (B) LINC00460 was gradually elevated with advanced staging as measured by an in situ hybridization assay. **P<0.01 and ***P<0.001 as normalizing and comparing with clinical stage I group, respectively. (C, D) Expression of LINC00460 was upregulated in patients with liver metastasis (C) and lymph node metastasis (D) as checked by a qRT-PCR assay. **P<0.01, ***P<0.001, as normalizing and comparing to non-liver metastasis or N0 group, individually. (E) The overall survival in the patients with high LINC00460 (n=37) was significantly shorter than that in the patients with low LINC00460 (n=37), P<0.0001 as determined by Kaplan–Meier analyses. (F) LINC00460 expression was remarkably elevated in CRC cell lines HT29, HCT1116, SW480, and LOVO. ***P<0.001 as normalizing and comparing to NCM460 group. Data are shown as mean ± SD from three independent experiments.
Abbreviations: CRC, colorectal cancer; qRT-PCR, quantitative real-time PCR.
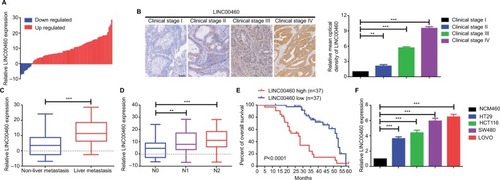
Table 2 Correlation of LINC00460 expression and clinicopathological features in CRC
Figure 2 Knockdown of LINC00460 inhibited migration/invasion and decreased LIMK2 expression in HT29 and LOVO cells.
Notes: (A) LINC00460 was knocked down by transfection of LINC00460-specific siRNAs which was determined by a qRT-PCR assay. (B) Knockdown of LINC00460 inhibited migration and invasion of CRC cell lines HT29 and LOVO as checked by a transwell assay. (C) Depression of LINC00460 significantly suppressed LIMK2 expression at protein level as measured by a Western blot assay. **P<0.01 as normalizing and comparing with the siSCR group. Data are shown as mean ± SD from three independent experiments.
Abbreviations: CRC, colorectal cancer; qRT-PCR, quantitative real-time PCR; siSCR, scramble control.
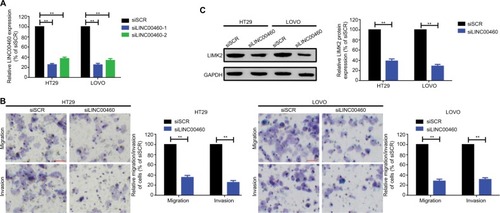
Figure 3 LINC00460 promoted migration/invasion by upregulation of LIMK2 in HT29 and LOVO cells.
Notes: (A, B) Overexpression of LINC00460 promoted LIMK2 expression while the facilitative effect was reversed by the silencing of LIMK2 in HT29 (A) and LOVO (B) cells as determined by a transwell assay. **P<0.01 and ns means non-significant as normalizing and comparing with pcDNA group. Data are shown as mean ± SD from three independent experiments.
Abbreviations: oe, overexpression; siSCR, scramble control.
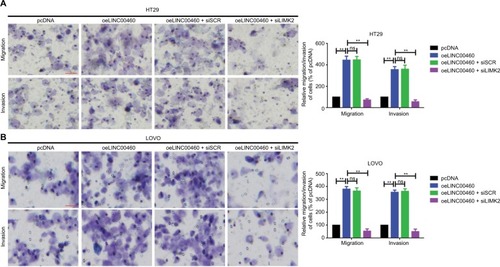
Figure 4 miR-939-5p suppressed migration/invasion via directly targeting LIMK2 in HT29 and LOVO cells.
Notes: (A) Up- and downregulation of LINC00460 did not affect LIMK2 mRNA expression as measured by a qRT-PCR assay. nsP>0.05 as normalizing and comparing with the mock group. (B) LINC00460 and LIMK2 shared a similar MRE for miR-939-5p as predicted by DIANA-LncBase (http://carolina.imis.athena-innovation.gr) and Targetscan (http://www.targetscan.org/vert_71). (C, D) Negative correlations between miR-939-5p and LIMK2 (C, P<0.0001) as well as miR-939-5p and LINC00460 (D, P=0.0001) were qualified by a Pearson’s correlation analysis. (E, F) Co-transfection of wt-LINC00460-luc (E) /wt-LIMK2-luc (F), and miR-939-5p mimic led to a significant weakening of luminescence as compared with mut-LINC00460-luc (E) / mut-LIMK2-luc (F), and miR-939-5p mimic co-transfection group, as determined by a luciferase assay. **P<0.01 and ns means non-significant as normalizing and comparing with NC mimic group. (G, H) Cell lysates were harvested from HT29 and LOVO cells and were incubated with biotin-labeled LINC00460-wt/LIMK2-wt and LINC00460-mut/LIMK2-mut individually. Subsequently, a qRT-PCR assay was performed to measure the pulled-down miR-939-5p in each group. As mentioned previously, it was LINC00460-wt/LIMK2-wt rather than LINC00460-mut/LIMK2-mut that could pull down miR-939-5p. **P<0.01 as normalizing and comparing to Beads group. (I) Diagram of the constructed LINC00460 or LIMK2 reporter plasmid containing a wild or a mutant MREs-939-5p. (J, K) Upregulation of miR-939-5p suppressed HT29 (J) and LOVO (K) cell metastasis, while the inhibitory effect was reversed by a wild LIMK2 overexpressing plasmid (oeLIMK2-wt) but not by a mutant one (oeLIMK2-mut). nsP>0.05; **P<0.01. Magnification, 4×; scale bars, 500 μm.
Abbreviations: ns, non-significant; wt, wild type; mut, mutation; qRT-PCR, quantitative real-time PCR; siSCR, scramble control; NC, negative control.
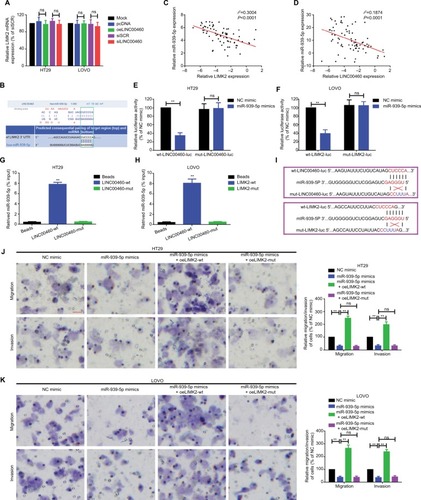
Figure 5 LINC00460 promoted migration/invasion through miR-939-5p sponging in HT29 and LOVO cells.
Notes: (A) Up- and downregulation of LINC00460 negatively affected miR-939-5p expression as determined by a qRT-PCR assay. **P<0.01 as normalizing and comparing with pcDNA group. (B) Elevation and depression of miR-939-5p also negatively regulated LINC00460 expression as measured by a qRT-PCR assay. **P<0.01 as normalizing and comparing with NC mimic group. (C) Diagram of the wild and mutant LINC00460 overexpression plasmids containing a wild or a mutant MREs-939-5p. (D, E) LIMK2 protein expression after different intervention was checked by a Western blot assay in HT29 and LOVO cells. nsP>0.05; **P<0.01. (F, G) Migration and invasion ability of HT29 (F) and LOVO (G) cells were promoted by a wild-type (oeLINC00460-wt) but not by a mutant-type (oeLINC00460-mut) LINC00460 overexpression plasmid, and the facilitative effect was attenuated by a miR-939-5p mimic. **P<0.01 and ns means non-significant as normalizing and comparing with the pcDNA group. Data are shown as mean ± SD from three independent experiments. Magnification, 4×; scale bars, 500 μm.
Abbreviations: ns, non-significant; wt, wild type; mut, mutation; qRT-PCR, quantitative real-time PCR; siSCR, scramble control; NC, negative control; MREs, microRNA response elements.
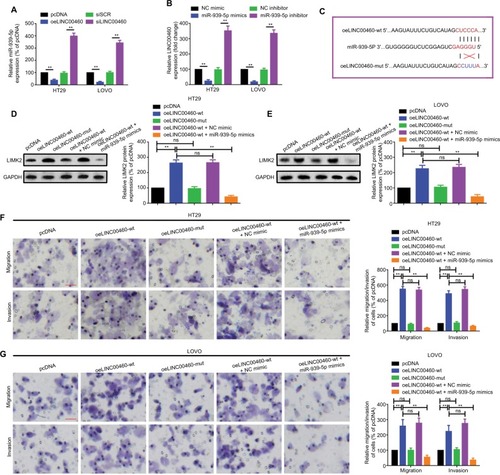
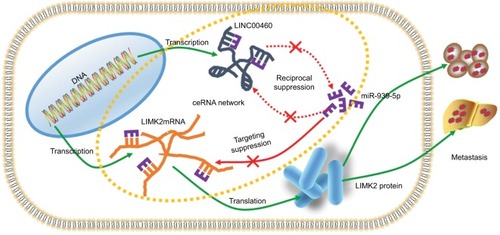
Figure 6 Schematic diagram of mechanism derived from investigations of this study.
Notes: LINC00460 promoted LIMK2 expression and mediated metastasis via miR-939-5p sponging in CRC cells.
Abbreviation: CRC, colorectal cancer.