
Figures & data
Table 1 Patient characteristics according to grade of margin dysplasia
Figure 1 Grade of dysplastic margin and relapse-free survival. Notes: (A) Mild vs moderate vs severe. (B) Mild vs moderate/severe.
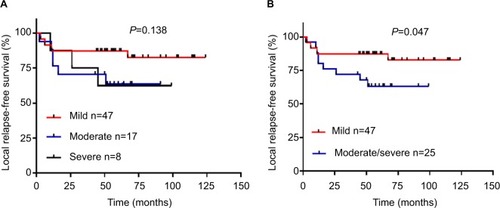
Figure 2 p53 expression pattern in oral epithelial mucosa.
Notes: (A) Surface/middle layer. (B) Spinous layer. (C) Basal layer. (D) Lamina propria. (E) Submucosa. Scale bar: 500 μm (40×), 50 μm (400×).
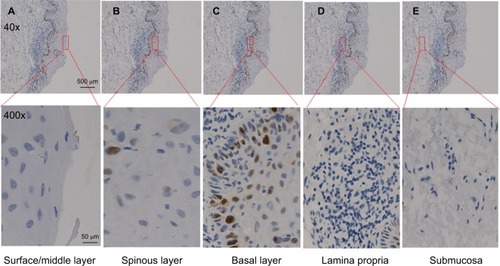
Figure 3 p53 expression in dysplastic margin.
Notes: (A) Normal margin. (B) Mild dysplasia. (C) Moderate dysplasia. (D) Severe dysplasia. Scale bar: 500 μm (40×), 250 μm (200×).
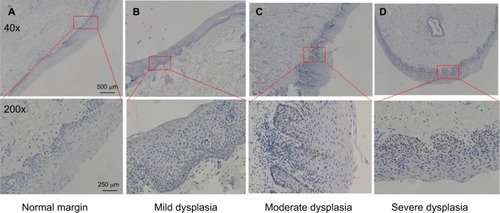
Figure 4 p53 expression score in dysplastic margin.
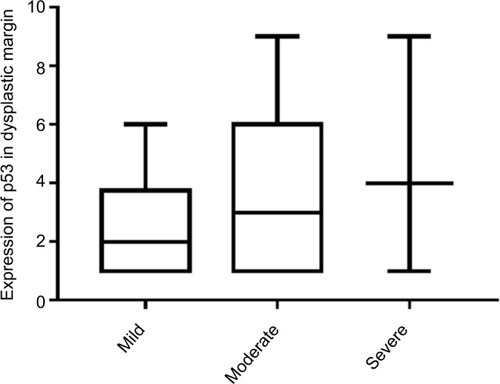
Table 2 Score table of immunohistochemistry quantification
Table 3 Expression of p53 in different locations of oral epithelial mucosa
Figure 5 Relationship between p53 expression and relapse-free survival in mild/moderate/severe dysplasia groups.
Notes: (A) Mild. (B) Moderate. (C) Severe.
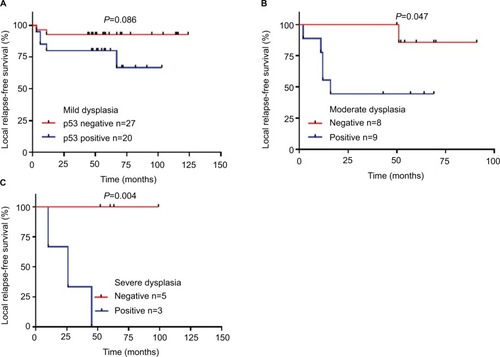
Table 4 p53 expression in dysplasia margin
Table 5 p53 status combine with grade of surgical margin dysplasia in relation to the disease reccurence
Figure 6 Grade of dysplasia and relapse-free survival (RFS) according to p53 expression.
Notes: (A) p53 and RFS. (B) p53-positive group. (C) p53-negative group.
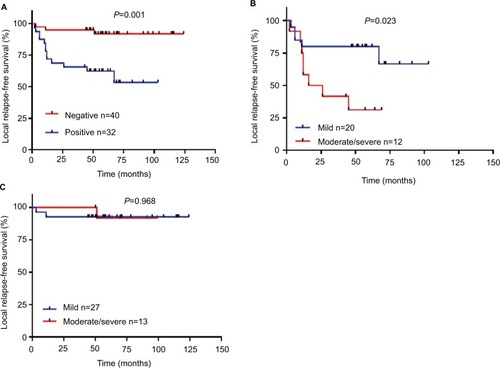
Table 6 Histopathological and molecular markers that determine local relapse-free survival