
Figures & data
Table 1 Relationship between Apolipoprotein C1 (APOC1) expression and clinicopathological features in 140 colorectal cancers
Figure 1 Apolipoprotein C1(APOC1) is overexpressed in primary colorectal cancer (CRC).
Notes: (A) APOC1 was highly expressed in CRC (n=380) samples compared to adjacent normal (n=50) samples based on The Cancer Genome Atlas (TCGA) database (unpaired t-test, P=0.012). (B) APOC1 was highly expressed in colorectal cancer samples compared to the adjacent normal samples of a matched paired group (n=25) based on The Cancer Genome Atlas (TCGA) database (paired t-test, P=0.002). (C) The mRNA expression level of APOC1 was higher in the majority of the 15 colorectal cancer tissues compared with the matched adjacent normal tissues (paired t-test, P<0.01). (D) The protein expression level of APOC1 was detected by Western blotting. Protein expression was higher in the colorectal cancer tissues (T1-T4) compared with the matched adjacent normal tissues (N1-N4). (E) Immunohistochemical detection of APOC1 protein expression in paraffin-embedded tissues. Positive APOC1 staining was observed mainly in the cytoplasm of CRC tissues; a and e, APOC1 was not detected in normal colorectal tissues; b and f, representative images of weak APOC1 staining in CRC tissues; c and g, representative images of moderate APOC1 staining in CRC tissues; d and h, representative images of strong APOC1 staining in CRC tissues; a, b, c, and d, original magnification ×100 (scale bar =100 μM); e, f, g, and h, ×400. (F) and (G) Kaplan–Meier survival analysis according to APOC1 expression in 140 patients with CRC. The overall survival (OS) and disease-free survival (DFS) for patients with high versus low APOC1 expression. The difference is statistically significant based on the log-rank test (both P<0.001).
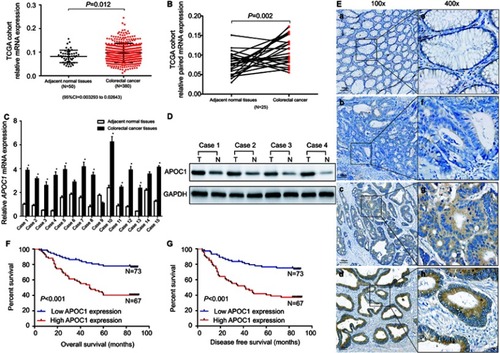
Table 2 Oncomine analysis of APOC1 expression in colorectal cancer (total 7 colorectal cancer cohorts)
Table 3 Cox regression analysis of potential overall survival factors for patients with colorectal cancer
Figure 2 Overexpression of APOC1 mRNA and protein in colorectal cancer (CRC) cell lines.
Notes: (A) and (B) Expression of APOC1 protein and mRNA in CRC cell lines (SW1116, SW620, HCT116, SW480 and LS174T) and an immortalized colonic epithelial cell line (NCW460) were examined by Western blotting and qPCR. The expression levels were normalized against GAPDH. The error bars represent the the mean (SD) calculated from three parallel experiments. *P<0.05. (C) and (D) Successful knockdown of APOC1 in SW480 and SW620 CRC cell lines. qPCR and Western blotting were used to detect APOC1 knockdown efficiency in untransfected cells, cells transfected with si-Control (negative control siRNA) and cells transfected with si-RNA1, si-RNA2 and si-RNA3. **P<0.01 and ***P<0.001.
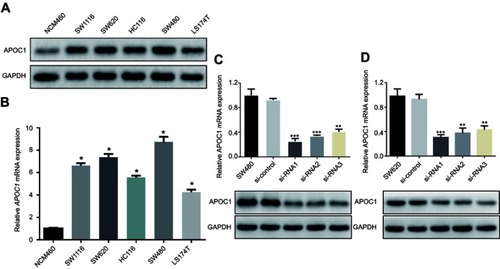
Figure 3 Effects of APOC1 knockdown on the proliferation, apoptosis, migration and invasion of CRC cells after transfection with si-Control or si-APOC1.
Notes: (A) Cell proliferation of SW480 and SW620 cells was detected using the CCK-8 assay. (B) Representative images of the clonogenic cell survival assays that were performed in SW480 and SW620 cells. (C) Flow cytometry analysis of the proportion of the cells indicated in each stage of the cell cycle (G1, G2 and S) and the percentage of cells in the G0/G1, S and G2/M phase of the cell cycle were quantified and expressed as the mean ± SD from three independent experiments. (D) Levels of apoptosis in the SW480 and SW620 cells after transfection with si-Control or si-APOC1 for 24 hrs. The cells were stained with Annexin V and PI. (E) Cell migration and invasion in SW480 and SW620 cells were assessed using Transwell assay with or without a Matrigel-coated transwell chamber. Magnification, ×100. (F) Detection of Bcl-2, caspase-9, cyclin D1 and cyclin B1 protein levels by Western blotting. Detection of GAPDH was used as a loading control. Blank: wild-type cells; si-Control: negative control siRNA; si-APOC1: APOC1-siRNA transfected cells (*P<0.05, **P<0.01 Vs si-APOC1).
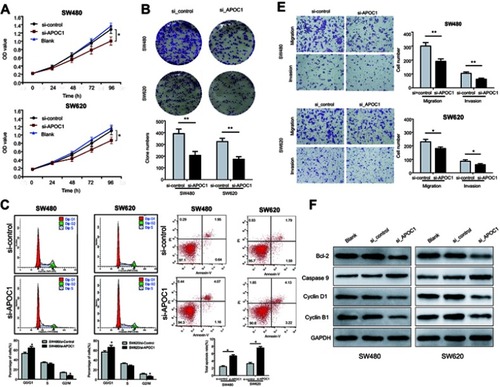
Figure 4 Silencing of APOC1 suppresses the expression of mitogen-activated protein kinase (MAPK) signaling-related genes.
Notes: (A) GSEA-generated heatmap for highly enriched genes in the MAPK signaling pathway in the APOC1-higher expression group compared to the APOC1-lower expression group from the TCGA COAD-READ dataset. (B) GSEA on the TCGA COAD-READ dataset identified MAPK signaling pathways as a regulatory target of APOC1. The GSEA enrichment plot shows values for normalized enrichment score (NES) =1.87 and nominal P-value =0.004. (C) Protein levels of the MAPK pathway-related genes were evaluated by Western blotting in SW480 and SW620 cells at 48 hrs after transfection with si-Control or si-APOC1. GAPDH was used as a loading control. Band intensity given underneath gel image was measured using ImageJ software, presented as fold change compared with controls, respectively. Blank: wild-type cells; si-Control: negative control siRNA; si-APOC1: APOC1-siRNA transfected cells.
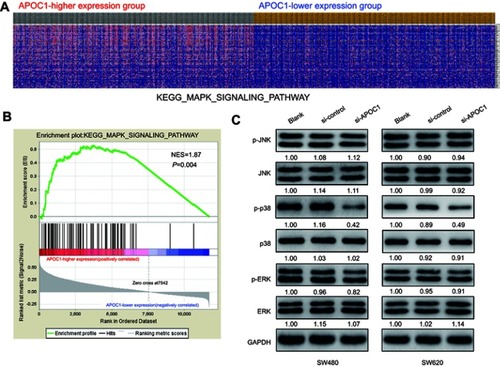
Figure S1 Gene set enrichment analysis (GSEA) enrichment analysis of the co-expressed genes.
Notes: (A) GSEA-generated heatmap for highly enriched genes in extracellular matrix (ECM) receptor interaction and the Toll-like receptor (TLR) signaling pathway on APOC1-higher expression group compared to the APOC1-lower expression group from the TCGA COAD-READ dataset. (B) GSEA on the TCGA COAD-READ dataset identified ECM receptor interaction and the TLR signaling pathway as regulatory targets of APOC1. The GSEA enrichment plot shows values for normalized enrichment score (NES) =2.00, NES =1.91 and P<0.001, P=0.002.
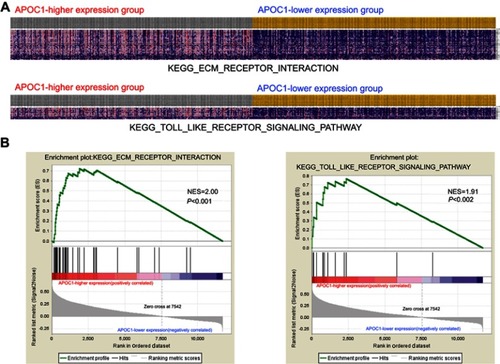
Table S1 Small interfering RNA (siRNA) sequences that target apolipoprotein C1 (si-APOC1) and negative control siRNA (si-Control)
Table S2 PCR primers for APOC1 and downstream target genes
Table S3 Cox regression analysis of potential diseases free survival factors for patients with colorectal cancer