Figures & data
Table 1 Patient characteristics and pathological findings in patients with different T stages (≧T2b or <T2b)
Table 2 Effect of univariate and multivariate variables on the T stage (≧T2b or <T2b)
Table 3 Mean white blood cell subtype counts, neutrophil–lymphocyte ratio, and platelet–lymphocyte ratio in study subjects
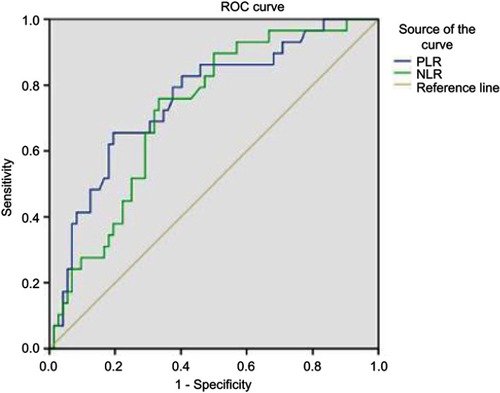
Figure 1 Receiver-operating curve for the relationship between the NLR and PLR and the T stage (≧T2b or <T2b).
Notes: Areas under the curve for the NLR and PLR are 0.758 (95% CI 0.619–0.825, P=0.001) and 0.722 (95% CI 0.654–0.862, P<0.001), respectively.
Abbreviations: NLR, neutrophil–lymphocyte ratio; PLR, platelet–lymphocyte ratio; ROC, receiver-operating characteristic.