
Figures & data
Figure 1 The generation of SCs and NSCs. 4T1 cells passaged in flasks or in vivo (Balb/c mice) were cultured at an average density of 1 cell per well in 96-well plate, 2 distinct types of clones were observed and the percentage of SCs and NSCs were about 9.1±1.3% and 90.9±1.3% (Figure 1B), respectively. Data are from 20 independent experiments.
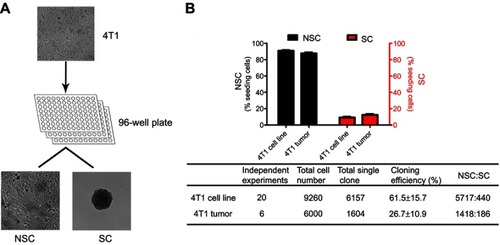
Figure 2 The characters of SCs and NSCs. (A) The surface markers of SCs and NSCs. The results were confirmed by 3 independent experiments. The scale bar=50 μm. (B) Under 3D culture, SC cells formed acinar-like colony while NSC cells did not form such colonies. The results were confirmed by 3 independent experiments. The scale bar=50 μm. (C–F) Glycolysis and cell growth rate of bulky 4T1, NSCs, and SCs. Data are mean ± SEM, n=9, from 3 independent experiments.
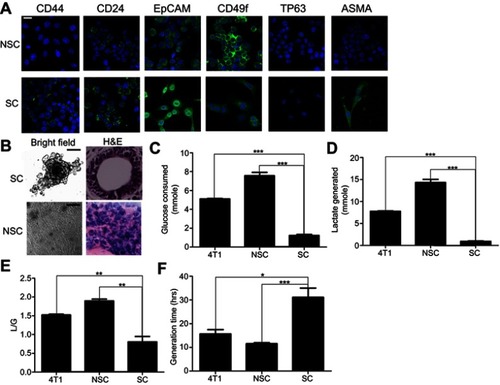
Figure 3 SCs exhibit a higher metastatic competent than NSCs and bulky 4T1 cells. (A–C) The curves of body weight, tumor size, and tumor weight on the day of sacrifice. (D–G) Metastasis at lung, heart, and bone. Data are mean ± SEM from 3 independent experiments, n=30 for each group. (H) Heat map of the genes associated with metastasis among SCs and NSCs. Note: Significance was defined at ***P<0.001, **P<0.01, *P<0.05
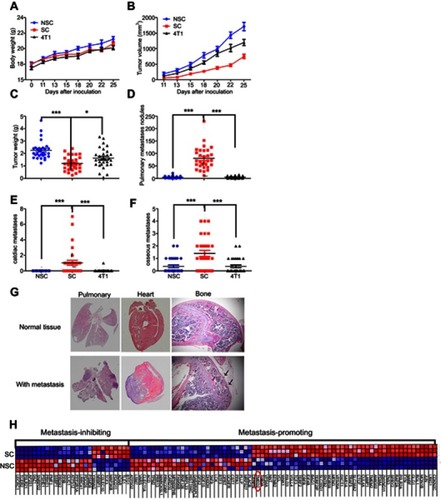
Figure 4 The expression level of TMED2 in breast cancer and normal breast cancer. (A) The expression of TMED2 was elevated in breast cancer compared to normal breast tissues. Data derived from UALCAN database. (B–C) Immunohistochemical analysis of TMED2 expression in breast cancer and normal mammary tissue and overview of TMED2 protein levels in breast tumor tissues and normal breast tissues. Data derived from the Human Protein Atlas database. (D) The TMED2 protein expression of breast cancer tissue (a–c), breast normal tissue (d–f), SCs and NSCs were examined by Western Blot and β-actin was used as an internal reference. Data were from 3 independent experiments. (E) The DNA methylation level of breast cancer and normal breast tissue, the Beta value indicates level of DNA methylation ranging from 0 (unmethylated) to 1 (fully methylated). Different beta value cut-off has been considered to indicate hyper-methylation. Data derived from UALCAN database. (F) The DNA copy number of breast cancer and normal breast tissue and data derived from oncomine database and analyzed with GraphPad.
Figure 5 Prognostic value of TMED2 expression in patients with breast cancer. (A) The overall survival of SCs and NSCs. Mice were randomly subcutaneously injected with 1×10⁴ SCs or NSCs. The day the mice died was recorded, n=10 for each group. (B–J) The expression level of TMED2 in breast cancer patients with different intrinsic subtypes included basal-like, HER2-positive, Luminal A and Luminal B breast cancer. Data derived from Kaplan–Meier (KM) plotter database.
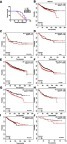
Table 1 Correlation of TMED2 mRNA expression with OS in different grades of breast cancer patients
Table 2 Correlation of TMED2 mRNA expression with OS in different lymph-node statuses of breast cancer patients
Table 3 Correlation of TMED2 mRNA expression with OS in different TP53 statuses of breast cancer patients