Figures & data
Figure 1 Flow diagram of the literature search and trial selection process.
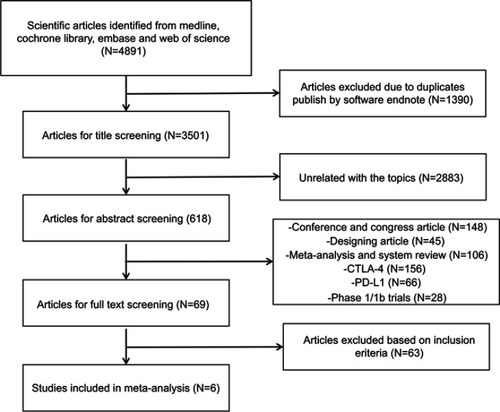
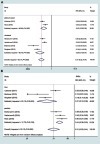
Table 1 Characteristics of the included studies
Table 2 Quality assessment by the Cochrane Collaboration’s tool
Figure 2 Forest plots of overall survival for PD-1 inhibitors monotherapy or chemotherapy.
Abbreviations: OS, overall survival; HR, hazard ratio.
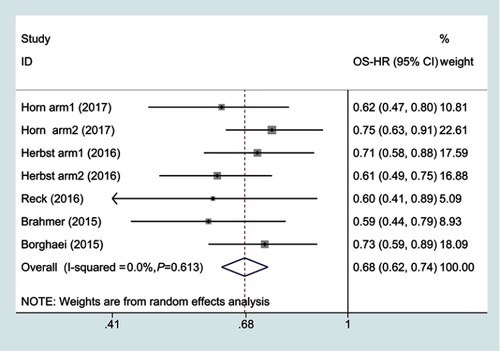
Figure 3 Subgroup hazard ratio of progression-free survival for PD-1 inhibitors monotherapy or chemotherapy.
Abbreviations: PFS, progressive-free survival; HR, hazard ratio.
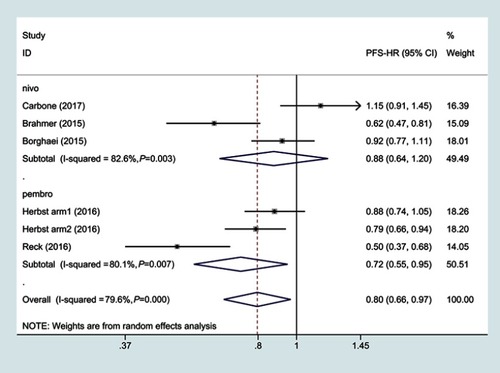
Figure 4 Forest plots of objective response rate for PD-1 inhibitors monotherapy or chemotherapy.
Abbreviations: ORR, objective response rate; RR, risk ratio.
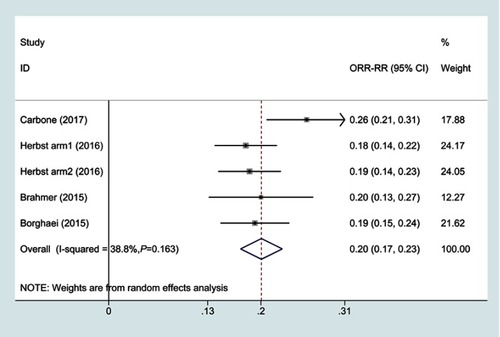
Figure 5 Forest plots of overall survival (OS) for PD-L1 expression level.
Abbreviation: HR, hazard ratio.
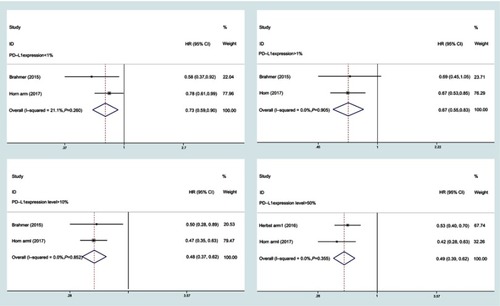
Figure 6 Forest plots of relative risks of treatment-related adverse events associated with PD1 versus chemotherapy.
Abbreviations: AEs, adverse events; RR, risk ratio.
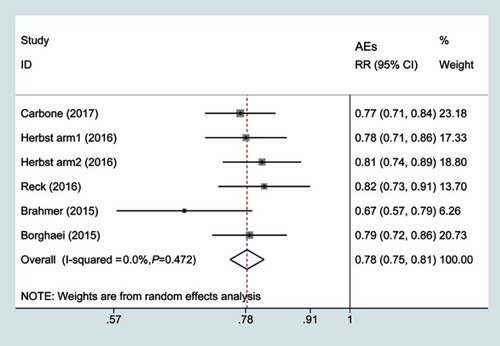
Figure 7 Subgroup risk ratio of severe adverse events. (A) Subgroup risk ratio of severe adverse events based on docetaxel and platinum duplexes. (B) Subgroup risk ratio of severe adverse events associated with PD1 versus chemotherapy.
Abbreviations: SAEs, severe adverse events; RR, risk ratio.