
Figures & data
Table 1 Baseline demographics and clinical characteristics of patients in the training cohort and the validation cohort
Table 2 Univariate analysis of the training cohort
Table 3 Multivariate analysis of the training cohort
Figure 1 Nomogram for predicting overall survival after curative resection of PHCC.
Notes: To obtain the corresponding survival probability, sum up each variable score and draw a vertical line from the total points scale to the survival rate scale.
Abbreviations: ALB, albumin; PHCC, primary hepatocellular carcinoma; PVTT, portal vein tumor thrombus; TBil, total bilirubin.
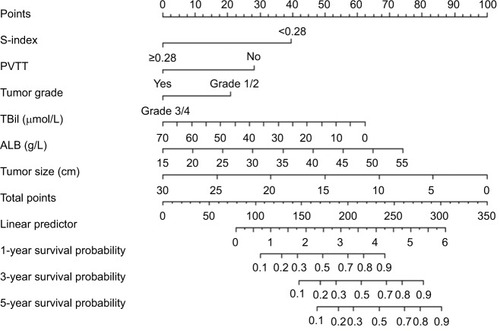
Figure 2 Calibration curves for predicting overall survival probability by the nomogram in the training and validation sets.
Notes: Calibration curves of the prognostic nomogram for 1-year overall survival (A), 3-year overall survival (B) and 5-year overall survival (C) in the training set, correspondingly, calibration curves for 1-year overall survival (D), 3-year overall survival (E), and 5-year overall survival (F) in the validation set.
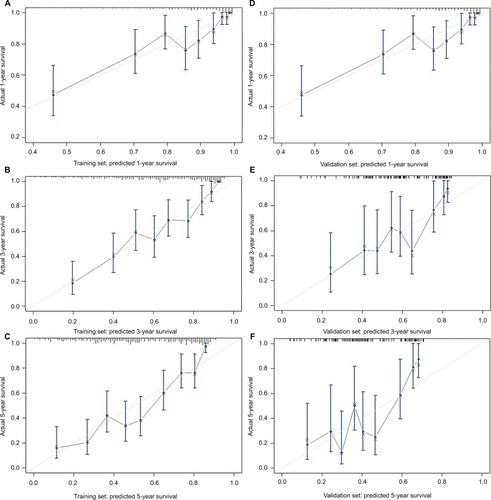
Figure 3 The tdROC curve of the prognostic nomogram, S-index, CLIP, BCLC and Okuda score in the training cohort.
Note: The tdROC curve for 1-year survival (A), 3-year survival (B), and 5-year survival (C).
Abbreviations: BCLC, Barcelona Clinic Liver Cancer; CLIP, Cancer of the Liver Italian Program; tdROC, time-dependent receiver operating characteristic.
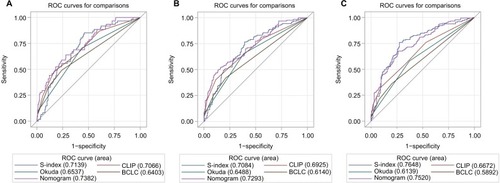
Figure 4 Survival curves stratified by the score calculated by the nomogram in the training cohort (low risk: <200; intermediate risk: 200–250; and high risk: >250).

Table 4 Nomogram scoring system
Figure S1 The tdROC curve for S-index.
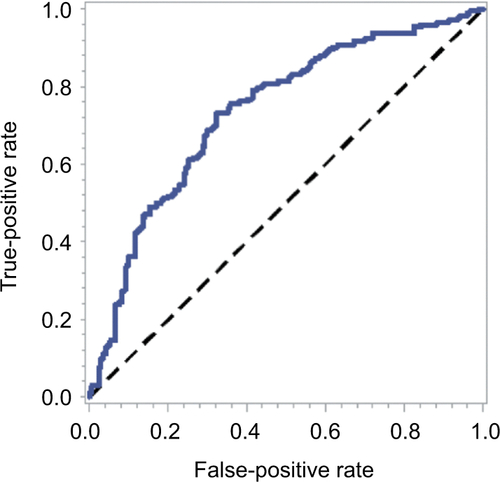
Table S1 The optimal cutoff value of S-index