
Figures & data
Figure 1 The mRNA expression profile of PRDX2 knockdown in HCT116 cells and DNM3 is a downstream protein of PRDX2. (A–C) PRDX2 siRNA was conducted and introduced into HCT116 cells. The mRNA expression profile was determined by RNA-Sequencing. The volcano plot (A) and heatmap (B) of different RNA expression profile, and the number of differently expressed genes (C). (D) The protein expression of PRDX2 and DNM3 was detected by Western blot in HT29, SW480, HCT116 and SW1116 cells. (E) The effects of PRDX2 knockdown or PRDX2 overexpression on DNM3 expression were tested by Western blot. The intensities of protein bands were quantified by Image J software. GAPDH was used as an internal control. *P<0.05. All experiments were performed in triplicate.
Abbreviations: DNM, Dynamin; DEGs, differently expressed genes; PRDX2-KD, cells transfected with siRNA-PRDX2 (PRDX2 knockdown); PRDX2-OV, cells transfected with pcDNA3.1-PRDX2 (PRDX2 overexpression); NC, negative control.
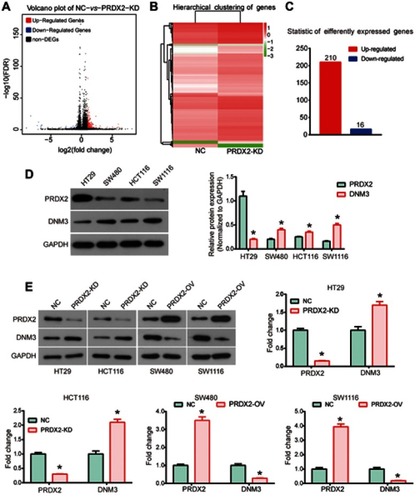
Figure 2 Dynamin 3 (DNM3) was down-regulated in colon cancer. (A) The expression of DNM3 in colon cancer and paired para-carcinoma tissues was investigated by Western blot. (B) Quantitative analysis of Western blot results. (C) Immunohistochemistry analysis was performed to detect the expression of DNM3 protein. The intensities of protein bands were quantified by Image J software. GAPDH was used as an internal control. *P<0.05.
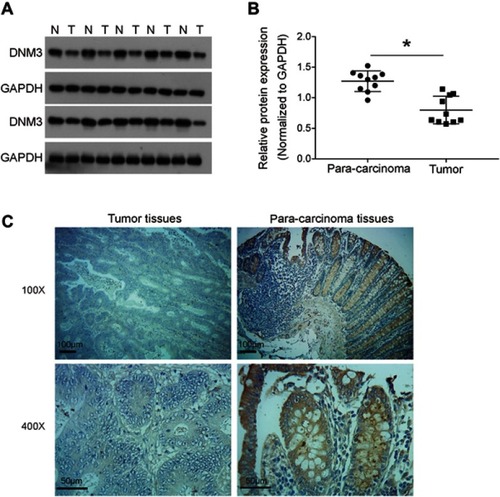
Figure 3 Dynamin 3 (DNM3) overexpression decreases cell viability in colon cancer cells. (A) DNM3 cDNA was cloned into pcDNA3.1 plasmid and introduced into HCT116 and HT29 cells, and the empty pcDNA3.1 plasmid was used as negative control (NC). The overexpression of DNM3 was validated by Western blot. The intensities of protein bands were quantified by Image J software. GAPDH was used as an internal control. (B) The effects of DNM3 overexpression on cell proliferation of HCT116 and HT29 cells were investigated by CKK-8 assay. (C) The cologenic ability was tested in DNM3 overexpressing HCT116 and HT29 cells. *P<0.05. All experiments were performed in triplicate.
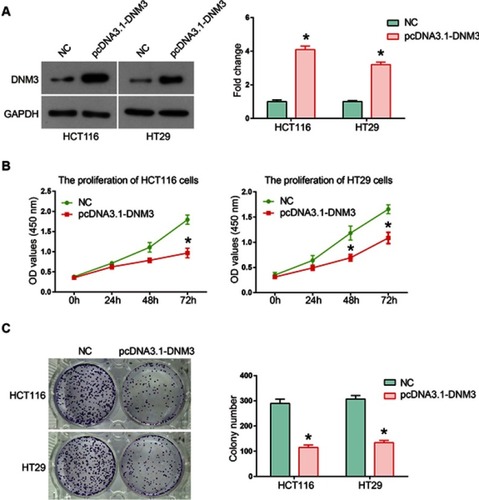
Figure 4 Dynamin 3 (DNM3) overexpression inhibits the migration and invasion of colon cancer cells. Cell invasion (A) and migration (B) were investigated by transwell assays in DNM3 overexpressing HCT116 and HT29 cells. (C) The proteolytic activities of secreted MMP9 were investigated by gelatin zymography assay. (D) Quantitative analysis of gelatin zymography assay results. *P<0.05. All experiments were performed in triplicate.
Abbreviation: NC, negative control.
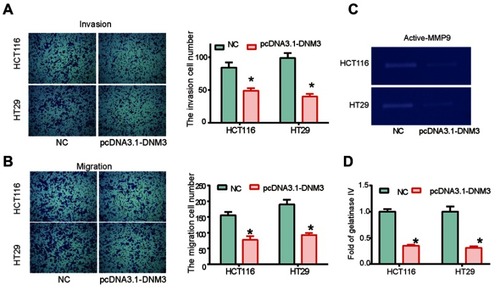
Figure 5 Dynamin 3 (DNM3) overexpression induces apoptosis in colon cancer cells. (A) Cell apoptosis was investigated by Annexin V/PI staining and flow cytometry. (B) and (C) Photomicrographs of double-fluorescent staining with PI (red) and Hoechst 33342 (blue) in HCT116 (B) and HT29 (C) cells. PI-positive cells were counted in approximately 200 cells from three random microscopic fields for each sample and are expressed as percentages of the total cells. *P<0.05. All experiments were performed in triplicate.
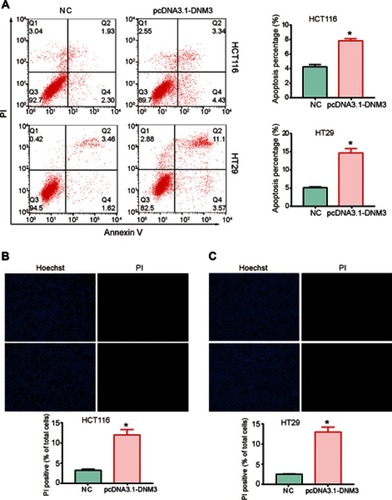
Figure 6 Dynamin 3 (DNM3) overexpression leads to activation of mitochondria apoptosis pathway and down-regulation of AKT signaling pathway. (A) The expression of mitochondria apoptosis pathway members Bcl2, Bax and Caspase-3-P17 was investigated by Western blot. (B) The expression of AKT signaling pathway members AKT, p-AKT, p70S6K and Cyclin D1 was investigated by Western blot. The intensities of protein bands were quantified by Image J software. GAPDH was used as an internal control. *P<0.05. All experiments were performed in triplicate. Supplementary data.
Abbreviation: NC, negative control.
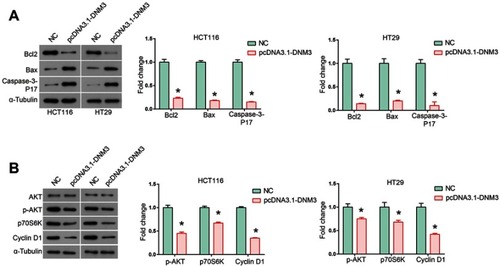
Figure S1 Expression of selected genes.
Notes: After PRDX2 was silenced, the mRNA expression of selected genes was examined using RT-PCR. *P<0.05. All experiments were performed in triplicate.
Abbreviation: NC, negative control.
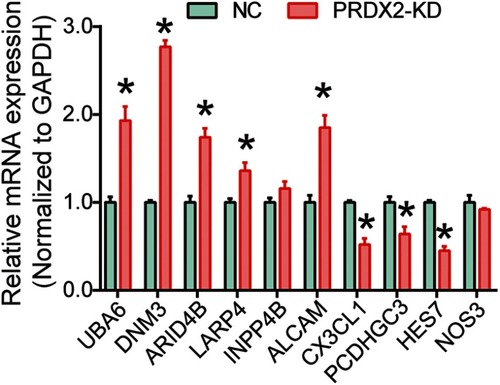
Table 1 DNM3 expression in colon cancer tissues compared with para-carcinoma tissue
Table 2 DNM3 expression is associated with the clinicopathological parameters in colon cancer
Table S1 Expression level of candidate genes after PRDX2 knockdown