
Figures & data
Table 1 Patient characteristics
Figure 1 Immunohistochemistry of the MMR proteins. The tumor cells were assessed for expression of PMS2 (+), MLH1 (+), MSH2 (−), and MSH6 (−).
Abbreviation: MMR, mismatch repair.
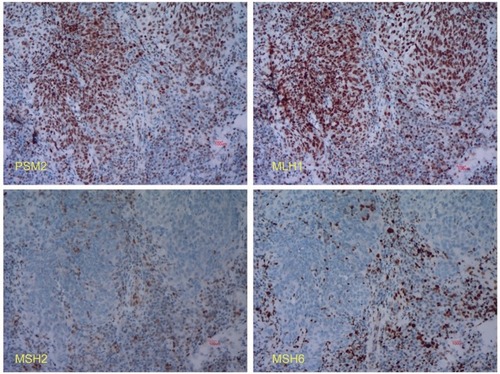
Figure 2 Immunohistochemistry of the MMR proteins. The tumor cells were assessed for expression of PMS2, MLH1, MSH2, and MSH6. The cancer nests in the bottom left are negative for MMR proteins, while those in the top right are all positive.
Abbreviation: MMR, mismatch repair.
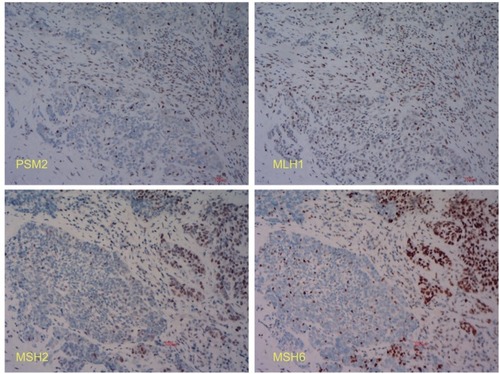
Figure 3 Immunohistochemistry of the cytokeratin (CK)–5/6 protein. The cells in the bottom left are tumor cells, whereas those in the top right are lymphocytes.
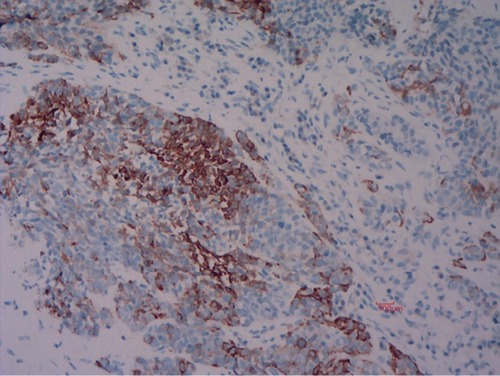
Figure 4 Capillary electrophoresis results from the MSI Multiplex System.
Notes: The shift in the size (bases) of the amplification products from tumor tissue (B) compared with the normal tissue specimen (A) was observed at two mononucleotide repeat loci (NR-21 and MONO-27), while the two pentanucleotide repeats (Penta C and Penta D) remained unchanged. Red arrows represent the NR-21, and blue arrows represent the MONO-27.
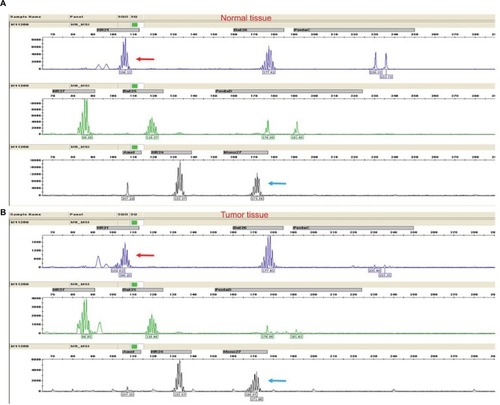
Figure 5 IHC of the PD-L1 in NPC tissue. The cell membrane was stained dark brown. (A) IHC staining of PD-L1 in TC is about 90%, while of TIIC is about 1%. (B) IHC staining of PD-L1 in the tumor nest (arrows indicated) is less than 1%. IHC staining of PD-L1 in the TIIC (around the TC) is about 60%. (C) The IHC positive control. Intense PD-L1 expression is observed in the outer surface of the trophoblastic epithelial cell membrane of the human placenta. The IHC negative controls for (A, B and C) are shown as (D, E and F), respectively.
Abbreviations: IHC, immunohistochemistry; NPC, nasopharyngeal carcinoma; PD-L1, programmed death-1 ligand; TC, tumor cells; TIIC, tumor-infiltrating immune cells..
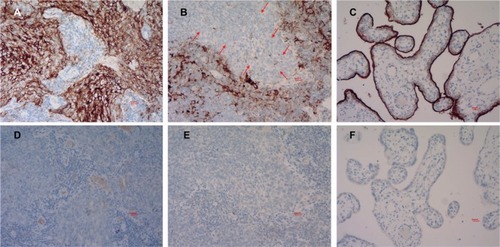
Table 2 PD-L1 expression in TC and TIIC
Table 3 Association of PD-L1 expression in TC and TIIC with disease variables