Figures & data
Table 1 The primers used in this study
Table 2 The clinical information of colorectal carcinoma tissues
Figure 1 The expression and the methylation status of CDH11 in CRC cell lines, primary colorectal and normal colorectal tissues. (A) Expression levels of CDH11 mRNA in CRC cell lines and normal colorectal tissues and the methylation status of CDH11 in CRC cell lines. (B) Restoration of CDH11 expression by TSA, Aza and the combination CRC cell line LoVo and HCT116, and performed by RT-PCR. “M” indicates methylated CDH11; “U” indicates unmethylated CDH11. (C) Representative methylation of CDH11 in primary colorectal tumour. (D) CDH11 expression levels in LoVo and HCT116 cells stably expressing CDH11 or pcDNA 3.1 and 16 pairs of CRC and adjacent tissues were measured by quantitative RT-PCR (qRT-PCR). (E) Representative images of CDH11 IHC in paried CRC tissues and adjacent tissues (magnification ×200 and ×400).
Abbreviations: CA, colorectal tumor adjacent tissues; CRC, colorectal cancer tissues.
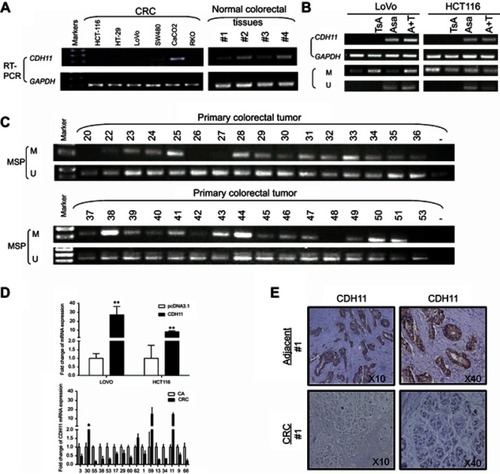
Figure 2 Overexpression of CDH11 inhibits the cell proliferation and colony formation in LoVo andHCT116 cell lines. (A) Expression of CDH11 in vector- and CDH11-transfected cells by RT-PCR. (B) Expression of CDH11by western blot analysis in vector- and CDH11-transfected in CRC cells. (C) CCK-8 assay for cell proliferation of vector-and CDH11-infected CRC cell lines. ***p<0.001, *p<0.05. (D) Representative colony formation assay in LoVo and HCT116 cells infected with the control vector and CDH11-expressing vector. (E) Quantitative analysis of colony formation (***p<0.001).
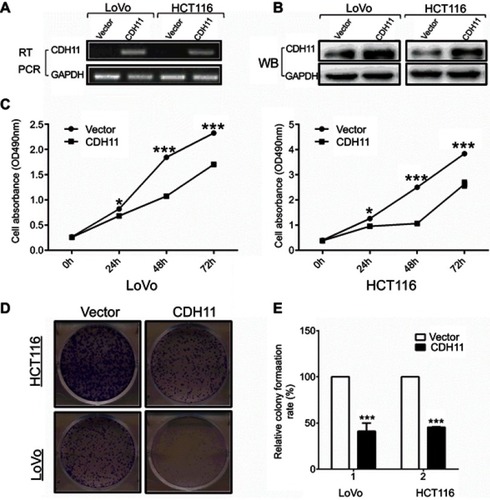
Figure 3 Flow cytometric analysis. (A) Overexpression of CDH11induced LoVo and HCT116 cell cycle arrest at G0-G1. Left: Representative distribution of cell cycles. Right: statistical summary of flow cytometry data. Values were assessed by Student’s t-test. The graph displays the mean ± SD of three independent experiments (**p<0.01); (***p<0.001). (B) The apoptosis rate of control vector andectopic expression of CDH11 in LoVo and HCT116 cell was detected by flow cytometric analysis with Annexin V-FITC and PI-staining (***p<0.001). (D) Western blot analysis of four classic markers of apoptosis, cleaved-PARP, Bax, cleaved-caspase 3, cleaved-caspase 9 in vector- and CDH11-transfectedLoVo and HCT116 cells, β-actin as a control.
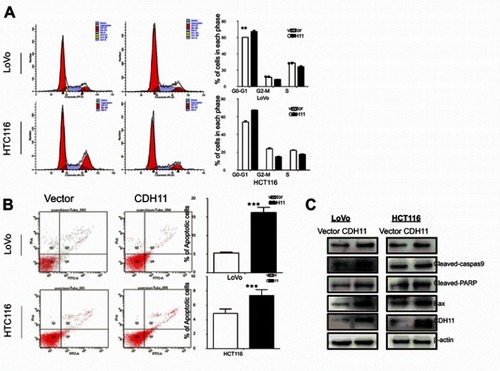
Figure 4 Ectopic expression of CDH11 inhibited the cell motility in LoVo and HCT116 cells. (A and B) Representative images of wound healing assay were captured at 0, 48 or 72 h, and quantitative analysis of migration length of vector- and CDH11-transfered LoVo and HCT116 cells, shown as means ± SD. ***p<0.001, **p<0.01, *p<0.05. And the suppressive effects of CDH11 on cell migration and invasion in CRC cells were investigated by transwell assays. Representative images of transwell (C) invation and (D) migration assays (magnification ×400) and quantitative analysis of the number of migrating and invasion cells (***p<0.001).
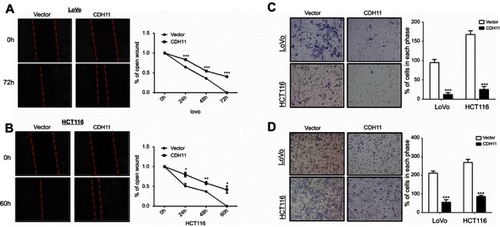
Figure 5 CDH11 suppresses the growth of tumor xenografts in nude mice. (A and B) Images of tumor xenografts in nude mice. (C) Tumor growth curve for vector-and CDH11-infected tumors in nude mice (*p<0.05). (D) Tumor weight of CDH11-infected cells in nude mice compared with control tumors (*p<0.05). (E) Representative images of IHC analysis of the expression of Ki67and HE staining in tumours from nude mice (magnification ×400).
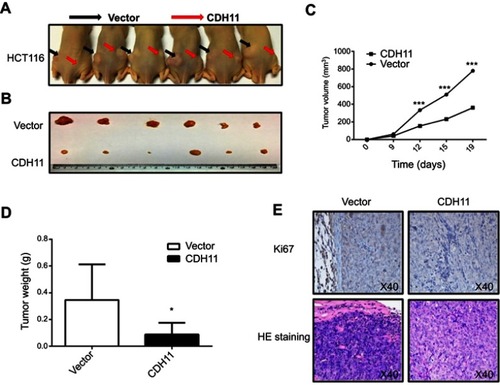
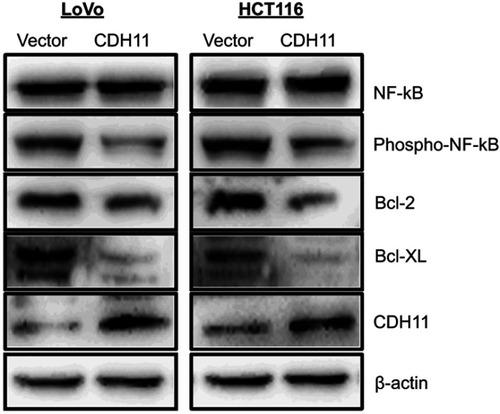
Figure 6 Overexpression of CDH11 antagonized NF-kB signaling pathway. Western blot was performed using antibodies against NF-kB, phospho-NF-kB and its downstream targets Bcl-2 and Bcl-XL; β-actin was used as a control.