
Figures & data
Table 1 Patients’ characteristics and details of univariate analysis (N=55)
Figure 1 Kaplan–Meier plot of PFS for all patients.
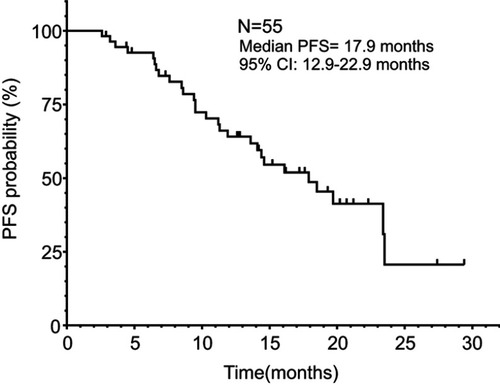
Table 2 Univariate and multivariate analysis for factors influencing progression free survival (PFS) of patients
Figure 2 Subgroup analysis of progression-free survival by baseline clinical characteristics and inflammatory biomarkers, including (A) biological Therapy, (B) AJCC stage, (C) melanoma subtype, (D) platelet count, (E) platelet to albumin ratio,(F) platelet to globulin ratio.
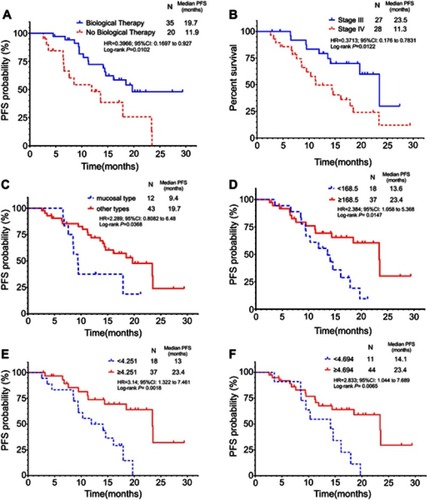
Figure 3 ROC curve analysis of the potential inflammatory biomarkers in patients with metastatic melanoma.
Abbreviations: AUC, area under curve; CI, confidence interval; PAR, platelet to albumin ratio; PGR, platelet to globulin ratio.
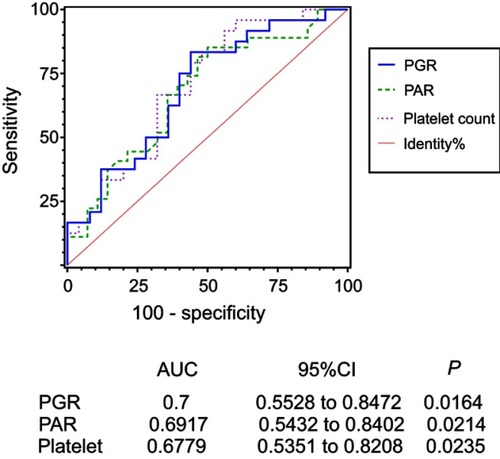
Table 3 Adverse events experienced by the patients (N=55)