
Figures & data
Figure 1 DCZ0814 induced cytotoxicity in MM cells and overcome the protective effect of the BM microenvironment. (A) Molecular structure of DCZ0814. (B) MM cells treated with DCZ0814 for 48 h and cell viability determined by CCK-8 assay. (C) MM cells treated with DCZ0814 for the indicated time and cell viability determined by CCK-8 assay. (D and E) Cell viability of ARP1 and OCI-MY5 cells treated with DCZ0814 alone or in the presence of IL-6 (25 ng/mL), IGF-1 (25 ng/mL) or BMSCs (HS-5) for 48 h. *p<0.05 compared with the 0 μM group, &p<0.05. (F) The percentage of Annexin-V positive cells. *p<0.05 compared with the 0 μM group. (G) BMSCs, ARP1, or both ARP1 and BMSCs cells were treated with DCZ0814 for 48 h, and apoptosis was detected by Annexin-V/PI staining followed by flow cytometry. Green represents BMSCs HS-5 cells, and red represents ARP1 cells. In each case, data are presented as the mean ± SD of triplicate treatments.
Abbreviations: MM, multiple myeoma; BM, bone marrow; CCK-8, cell counting kit-8; IL-6, interleukin-6; IGF-1, insulin-like growth factor-1; BMSC, bone marrow stromal cell.
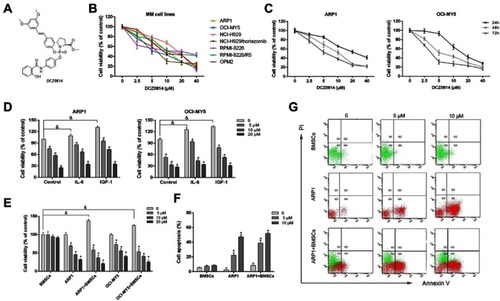
Figure 2 DCZ0814 treatment resulted in apoptosis of MM cells. (A and B) Apoptosis analyzed using Annexin V/PI staining and flow cytometry. Apoptotic cells include early apoptotic cells (Annexin V+/PI−) and late apoptotic cells (Annexin V+/PI+). (C) ARP1 cells were treated with DCZ0814 (0–20 μM) for 48 h. MMP was analyzed by flow cytometry using JC-1 dye. Only JC-1 green positive (lower right quadrant) cells were analyzed for the loss of MMP. (D) Columns represent the average percent of only JC-1 green positive cells from three independent experiments. (E) MM cells were pre-incubated and/or NAC (10 mM) for 2 h and then treated with DCZ0814 (15 µM) for 48 h, stained with AnnexinV-FITC/PI and analyzed by flow cytometry; and (F) the percentage of FITC positive cells treated with 15 µM of DCZ0814 that pre-incubated and/or NAC, while Rosup (50 μg/ml) was used as a positive control. (G) MM cells exposed to DCZ0814 (15 µM) and/or pan-caspase inhibitor Z-VAD-FMK (50 µM) for 48 h and analyzed by Annexin V/PI staining and flow cytometry. (H) Statistical analysis of Annexin-V positive cells in (G). (I) Human B lymphocytes WIL2-S cells were treated with DCZ0814 (0–20 μM) for 48 h and analyzed by flow cytometry. (J) PBMCs obtained from three healthy volunteers were treated with DCZ0814 for 48 h, and cell viability was then measured. (K) Primary CD138+ MM cells from patients were treated with DCZ0814 for 48 h, and apoptosis was then detected. (L) Western blot of the expression of apoptosis-related proteins. In each case, the untreated cells cultured in their growth medium were used as a control. Data are presented as the mean ± SD of three independent experiments and *p<0.05 compared with the 0 μM group.
Abbreviations: MMP, mitochondrial membrane potential; NAC, N-acetyl- L –cysteine; PBMCs, peripheal blood mononuclear cells; PI, propidium iodide; D, healthy donor; Pt, patient.
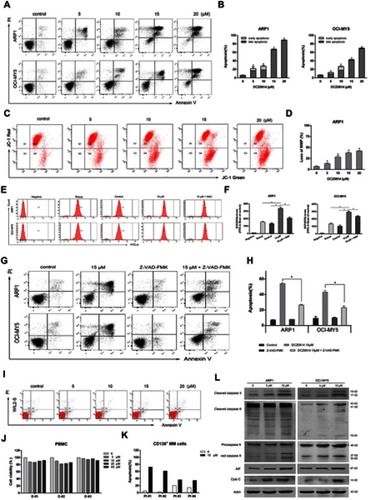
Figure 3 DCZ0814 caused G0/G1 arrest in MM cells. (A) Cell cycle analysis of MM cells treated with DCZ0814. The representative result of three repetitions is presented. (B) Cell cycle distribution in MM cells. Bar graphs show the percentage of cells in the G0/G1, S and G2/M phases of the cell cycle. (C) Western blot of the expression of G0/G1 phase-related proteins in MM cells treated with DCZ0814 for 24 h. In each case, the untreated cells cultured in their growth medium were used as a control. Data are presented as the mean ± SD (n=3).
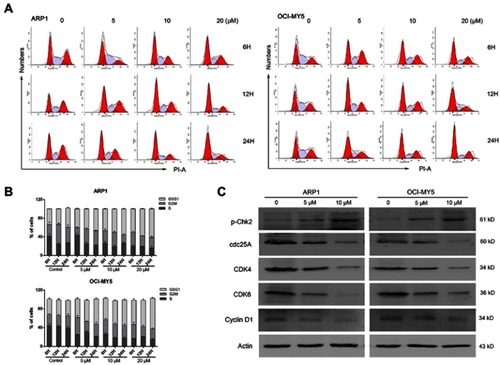
Figure 4 DCZ0814 inhibited mTOR kinase activity. (A) Expression of mTOR kinase activity-related proteins in ARP1 and OCI-MY5 cells treated or not with DCZ0814 for 48 h from three independent experiments. (B) Diagram illustrating the effects of DCZ0814 on mTORC1 and mTORC2. (C) Expression of mTOR kinase activity-related proteins in myeloma cells treated with DCZ0814 alone or in the presence of BMSCs (HS-5) for 48 h from three independent experiments, with Actin used as an internal control.
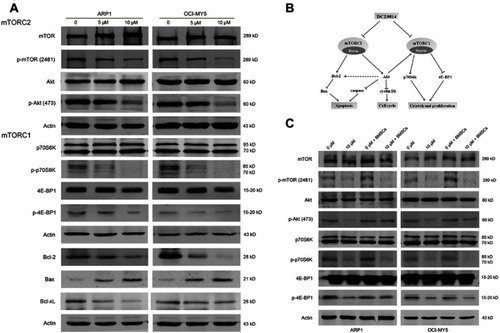
Figure 5 DCZ0814 exhibited anti-MM activity in vivo and synergized with novel and conventional anti-MM agents. (A) Tumors on day 19. (B) Tumor growth curve (n=6 tumors/group). Treatment with control (vehicles [5% DMSO and saline only]-treated) and DCZ0814 (10 mg/kg DCZ0814 in 5% DMSO and saline) began on day 0. (C) Body weight was measured daily for 19 days. At day 19 the difference between groups was not significant (p>0.05). Data are presented as the mean ± SD. *p<0.05. (D) Tumor sections were stained with HE, Ki-67, TUNEL or cleaved caspase-3. The positive cells in tumor sections stained with Ki-67,cleaved caspase-3 or TUNEL are the dark brown ones. (E–J) MM cells were treated with DCZ0814 plus bortezomib, panobinostat or dexamethasone for 48h. Cell viability was assessed by CCK-8 assay. Data are presented as mean ± SD. CI <1 indicates synergistic effects.
Abbreviations: HE, hematoxylin eosin; TUNEL, terminal deoxynucleotidy1 transferase dUTP nick end-labeling.
![Figure 5 DCZ0814 exhibited anti-MM activity in vivo and synergized with novel and conventional anti-MM agents. (A) Tumors on day 19. (B) Tumor growth curve (n=6 tumors/group). Treatment with control (vehicles [5% DMSO and saline only]-treated) and DCZ0814 (10 mg/kg DCZ0814 in 5% DMSO and saline) began on day 0. (C) Body weight was measured daily for 19 days. At day 19 the difference between groups was not significant (p>0.05). Data are presented as the mean ± SD. *p<0.05. (D) Tumor sections were stained with HE, Ki-67, TUNEL or cleaved caspase-3. The positive cells in tumor sections stained with Ki-67,cleaved caspase-3 or TUNEL are the dark brown ones. (E–J) MM cells were treated with DCZ0814 plus bortezomib, panobinostat or dexamethasone for 48h. Cell viability was assessed by CCK-8 assay. Data are presented as mean ± SD. CI <1 indicates synergistic effects.Abbreviations: HE, hematoxylin eosin; TUNEL, terminal deoxynucleotidy1 transferase dUTP nick end-labeling.](/cms/asset/250b5db5-53c1-46e7-b852-3528c17d685f/dcmr_a_12186256_f0005_c.jpg)