Figures & data
Figure 1 Oncosphere from cervical cancer cells exhibits high expression of stem cell markers.
Notes: Phase contrast photomicrographs and Western blot detection of the expression of SOX2 and OCT4 proteins (A) in parental adherent SiHa and CaSki cells (left), oncospheres in low-adherence culture (middle), and re-differentiated oncospheres that returned to adherent culture with 10% FBS medium (right); and (B) at days 1, 3, 5, and 7 from parental adherent SiHa and CaSki cells through development of spheroid clusters to oncospheres. (C) Immunofluorescence images of SOX2 and OCT4 in parental adherent SiHa and CaSki cells and oncospheres using an anti-SOX2/OCT4 (green) antibody and DAPI staining (blue) to indicate the cell nucleus. Images on the left show cells stained with anti-SOX2/OCT4, images in the middle show cells stained with DAPI, and images on the right are merged anti-SOX2/OCT4 and DAPI. All of the contrast of images were taken under the same conditions. *P<0.05 and **P<0.01 when comparing experimental and control groups (two-tailed Student's t test).
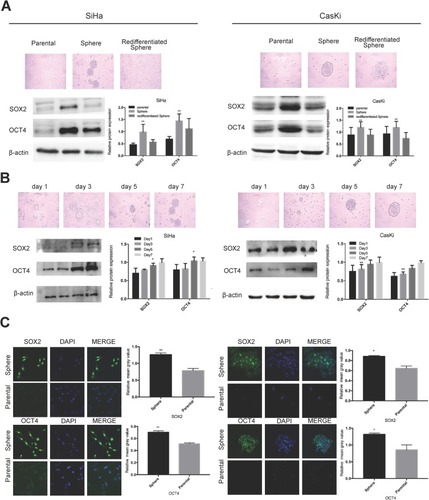
Figure 2 Oncosphere from cervical cancer cells exhibits self-renew and resistance to chemotherapeutic drugs.
Notes: (A) Growth inhibition of parental SiHa and CaSki cells and oncospheres. Both parental cells and oncospheres were seeded in 96-well plates and treated with paclitaxel or cisplatin at different concentrations (0, 1, 2, 5, 10, 20, 40, 60, 80, 100 nM) for 48 hrs, and cell viability was determined by a modified MTT assay. OD values of each treated group were compared with controls at the same time point. (B) Representative photomicrographs of clonal expansion of SiHa and CaSki cells into single oncospheres in low-adherence cultures over a 7-day period. The cluster of the oncospheres after days 1, 3, 5, and 7 of the culture was measured. An oncosphere was defined as being composed of more than 15 cells. Error bars and mean with SD were from three independent experiments. *P<0.05 and **P<0.01 when comparing experimental and control groups (two-tailed Student’s t test).
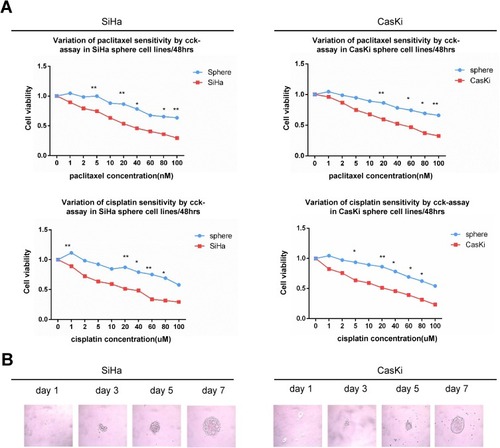
Figure 3 HPV 16 E7 maintains stemness in SiHa and Caski oncospheres.
Notes: (A) Phase-contrast photomicrographs of SiHa and Caski cells with HPV16 E7 knockdown in low-adherence culture for 7 days. (B) Western blot detection of the expression of SOX2 and OCT4 proteins in SiHa and Caski oncospheres with HPV16 E7 knockdown. (C) Immunofluorescence images of SOX2 and OCT4 in SiHa and Caski oncospheres with HPV16 E7 knockdown using an anti-SOX2/OCT4 (green) antibody. DAPI staining (blue) indicates cell nuclei. Images on the left show cells stained with anti-SOX2/OCT4, images in the middle show cells stained with DAPI, and images on the right are merged anti-SOX2/OCT4 and DAPI. All of the contrast images were taken under the same conditions. (D) Growth inhibition of in SiHa and Caski oncospheres with HPV16 E7 knockdown. Both were seeded in 96-well plates and treated with paclitaxel or cisplatin at different concentrations (0, 1, 2, 5, 10, 20, 40, 60, 80, 100 nM) for 48 hrs, and cell viability was determined by a modified MTT assay. OD values of each treated group were compared with controls at the same time point. (E) Representative photomicrographs of clonal expansion of single oncospheres from SiHa and Caski with HPV16 E7 knockdown in low-adherence cultures over a 7-day period. The cluster of the oncospheres after days 1, 3, 5, 7 of culture was measured. Western blot expression levels were normalized to those of β-actin. Error bars and mean with SD were from three independent experiments. *P<0.05 and **P<0.01 when comparing experimental and control groups (two-tailed Student’s t test).
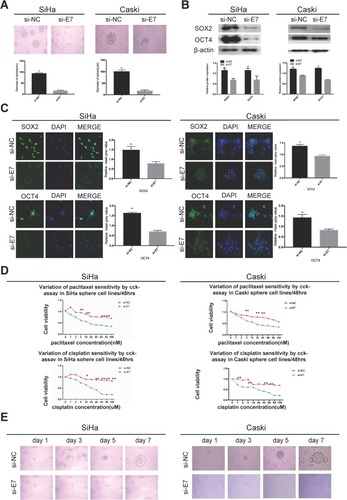
Figure 4 HPV 16 E7 maintains stemness in U2OS oncospheres.
Notes: (A) Phase-contrast photomicrographs of U2OS cells with HPV16 E7 overexpression in low-adherence culture for 7 days. (B) Western blot detection of the expression of SOX2 and OCT4 proteins in U2OS oncospheres with HPV16 E7 overexpression. (C) Immunofluorescence images of SOX2 and OCT4 in U2OS oncospheres with HPV16 E7 overexpression using an anti-SOX2/OCT4 (green) antibody. DAPI staining (blue) indicates cell nuclei. Images on the left show cells stained with anti-SOX2/OCT4, images in the middle show cells stained with DAPI, and images on the right are merged anti-SOX2/OCT4 and DAPI. All of the contrast images were taken under the same conditions. (D) Growth inhibition of U2OS oncospheres with HPV16 E7 overexpression. Both were seeded in 96-well plates and treated with paclitaxel or cisplatin at different concentrations (0, 1, 2, 5, 10, 20, 40, 60, 80, 100 nM) for 48 hrs, and cell viability was determined by a modified MTT assay. OD values of each treated group were compared with controls at the same time point. (E) Representative photomicrographs of clonal expansion of single oncospheres from U2OS with HPV16 E7 overexpression in low-adherence cultures over a 7-day period. The cluster of the oncospheres after days 1, 3, 5, 7 of culture was measured. Western blot expression levels were normalized to those of β-actin. Error bars and mean with SD were from three independent experiments. *P<0.05 and **P<0.01 when comparing experimental and control groups (two-tailed Student’s t test).
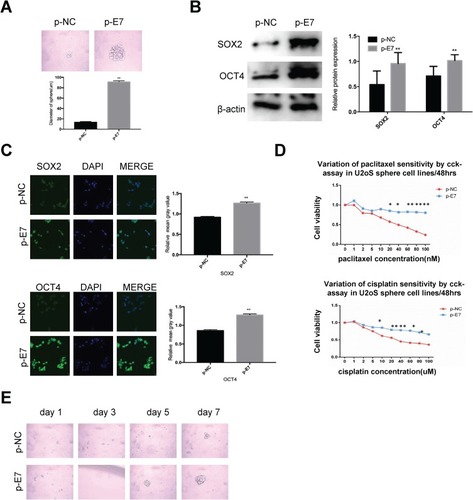
Figure 5 APH1B is involved in modulating stemness in SiHa oncospheres.
Notes: (A) Heat-map of four stem cell pathway-related genes, WNT5B, APC2, WNT9A, and APH1B. (B) Real-time RT-PCR detection of the expression of WNT5B, APC2, WNT9A, and APH1B mRNAs in si-E7 and si-NC SiHa oncospheres. (C) Western blot detection of APH1B protein in si-E7 and si-NC SiHa oncospheres. (D) Phase-contrast photomicrographs of SiHa oncospheres with APH1B inhibition or overexpression in low-adherence cultures for 7 days. (E) Western blot detection of SOX2 and OCT4 proteins in SiHa oncospheres with APH1B inhibition or overexpression. (F and G) Growth inhibition of SiHa oncospheres with APH1B inhibition or overexpression. Both were seeded in 96-well plates and treated with paclitaxel or cisplatin at different concentrations (0, 1, 2, 5, 10, 20, 40, 60, 80, 100 nM) for 48 hrs, and cell viability was determined by a modified MTT assay. OD values of each treated group were compared with controls at the same time point. (H) Representative photomicrographs of clonal expansion of single oncospheres from SiHa with APH1B inhibition or overexpression in low-adherence cultures over a 7-day period. The cluster of oncospheres after days 1, 3, 5, 7 of culture was measured. Western blot expression levels were normalized to those of β-actin. Error bars and mean with SD were from three independent experiments. *P<0.05 and **P<0.01 when comparing experimental and control groups (two-tailed Student’s t test).
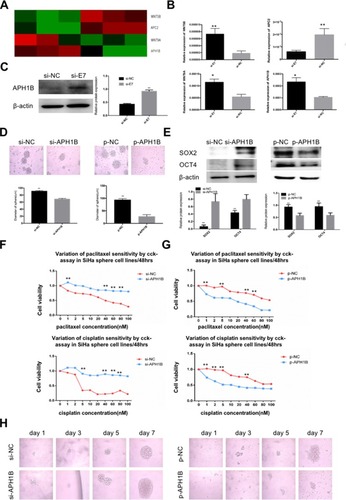
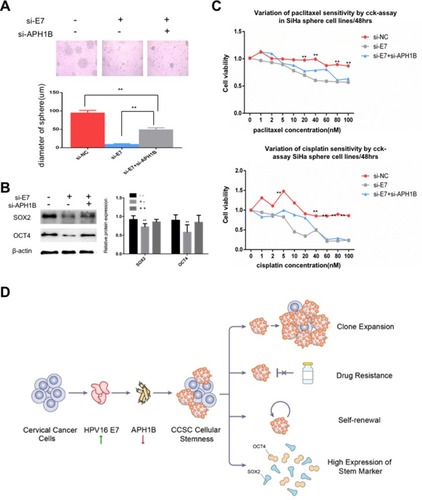
Figure 6 APH1B may participate in E7 maintenance of stemness in SiHa oncospheres.
Notes: (A) Phase-contrast photomicrographs of SiHa oncospheres with or without HPV16 E7 inhibition and APH1B inhibition in low-adherence cultures for 7 days. (B) Western blot detection of SOX2 and OCT4 proteins in SiHa oncospheres with or without HPV16 E7 inhibition and APH1B inhibition in low-adherence cultures for 7 days. (C) Growth inhibition of SiHa oncospheres with or without HPV16 E7 inhibition and APH1B inhibition. All sphere cells were seeded in 96-well plates and treated with paclitaxel or cisplatin at different concentrations (0, 1, 2, 5, 10, 20, 40, 60, 80, 100 nM) for 48 hrs, and cell viability was determined by a modified MTT assay. OD values of each treated group were compared with controls at the same time point. (D) Proposed model: APH1B may participate in the process of E7 maintaining cellular stemness. Western blot expression levels were normalized to those of β-actin. Measurements of the diameters of colonies are shown in the bar graph. Error bars and mean with SD were from three independent experiments. **P<0.01 when comparing experimental and control groups (two-tailed Student’s t-test).