Figures & data
Table 1 The clinical characteristics, demographics and pathological findings of all men
Table 2 Distribution of demographics and biopsy cores in different Gleason score, clinical stage and D’Amico risk
Table 3 The regression probability of PI-RADS in predicting Pca and the upper bound of 95% CI for mean under the regression probability of PI-RADS
Figure 1 The thresholds for predicting Pca and IH-Pca and the updated nomogram. (A) The new predictor and screening thresholds. (B) The updated nomogram.
Abbreviations: Pca, prostate cancer; IH-Pca, intermediate- and high-risk Pca; PSA, prostate-specific antigen; PSAD, PSA density; PV, prostate volume; PI-RADS, prostate imaging reporting and data system.
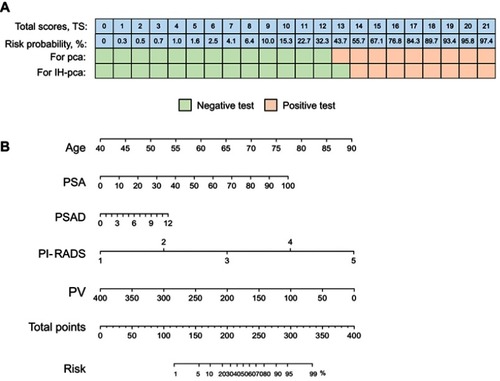
Table 4 Performance of PSA, PI-RADS, nomogram and TS in predicting the IH-Pca
Table 5 The value of NRI, OR and AUC of predictive methods in predicting the IH-Pca
Figure 2 The predictive performance of different methods. (A) The area under the curve (AUC) is used to compare the predictive power in predicting IH-Pca. (B) The AUC is performed to show the predictive power in predicting IH-Pca in population with radical prostatectomy. (C) The decision curve analysis is showing the predictive power in predicting IH-Pca. (D) The AUC is utilized to illustrate the performance of predicting significant Pca in cohort with radical prostatectomy. (E) Using AUC is to show the ability in forecasting the men following the criteria of PRIAS.
Abbreviations: Pca, prostate cancer; IH-Pca, intermediate- and high-risk Pca; PRIAS, Prostate Cancer Research International Active Surveillance.
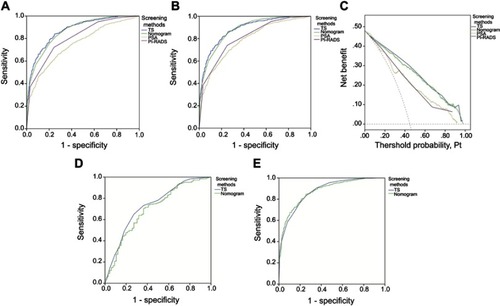
Figure 3 The distribution of men with N-LPca and with IH-Pca in the different screening methods. (A) The distribution of TS for men with N-LPca or with IH-Pca in positive tests of nomogram, PSA and PI-RADS. (B) The distribution of TS groups in different screening methods for men with N-LPca.
Abbreviations: N-LPca, normal men or low-risk prostate cancer; IH-Pca, intermediate- and high-risk Pca;TS, total score; PSA, prostate-specific antigen; PI-RADS, prostate imaging reporting and data system.
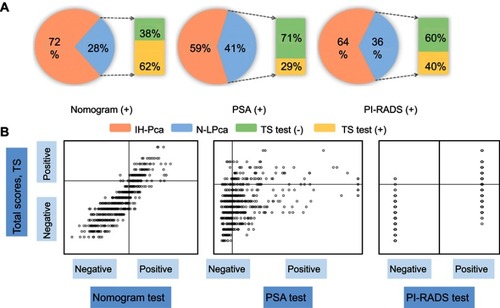
Figure 4 The value and mean of total scores and nomogram. (A) The value and mean of total scores in D’Amico risks. (B) The value and mean of nomogram in D’Amico risks.
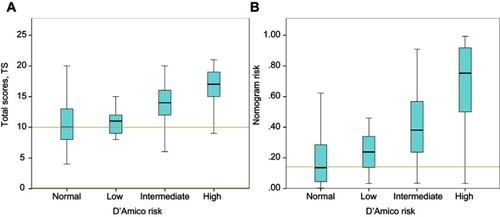
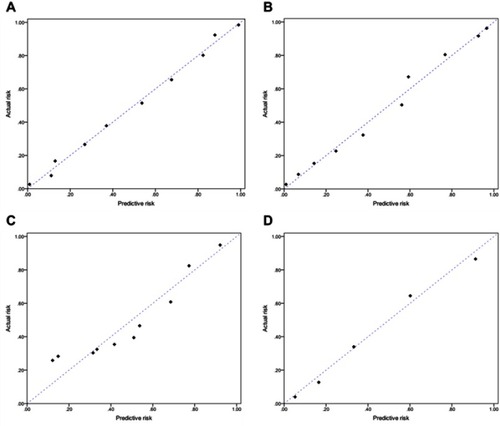
Figure 5 Calibration curves for the prediction models. (A) Total scores. (B) Nomogram. (C) PSA and (D) PI-RADS.
Abbreviations: PSA, prostate-specific antigen; PI-RADS, prostate imaging reporting and data system.