Figures & data
Figure 1 mRNA expression of proteasomal subunits between tumor and benign control. This figure 1 shows the 2^-delta Ct values (y axis) for the investigated proteasomal subunits (x axis) in malignant pleural mesothelioma (MPM) and benign control tissue (pneumothoraces). PSMA1, PSMA5, PSMB4, PSMB5 and PSMD1 were significantly higher in tumors (all p<0.001). In MPM, a consistent expression of all subunits was found between all 84 patients. Expression of PSMB1 and PSMB2 was not assessed in benign control samples.
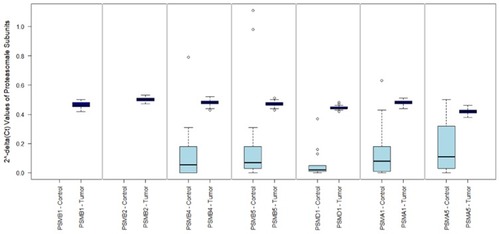
Figure 2 PSMB4 expression-dependent survival for TCGA/cBioPortal data. Figure 2 depicts the Kaplan–Meier curve for PSMB4expression-dependent survival. On the x axis, the time is depicted in days. On the y axis, the number of events is shown in percentage. PSMB4 and outcome showed a correlation with respect to the COXPH model (all tests; p<0.0175; CI 95%: 4.45e+11 to 3.05e+115). The data were derived from the “Mesothelioma” dataset from TCGA/cBioPortal (n=87 patients, survival data was available for n=56 patients). All other proteasomal subunits showed no correlation with survival.
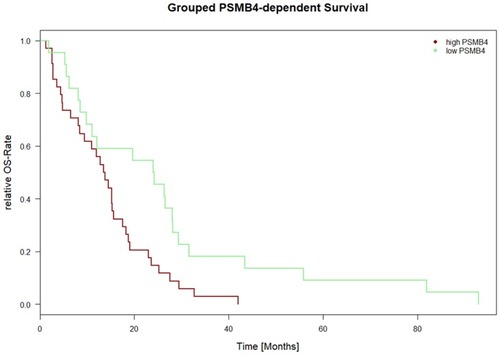
Table 1 Significant results for expression of proteasomal subunits and clinicopathological data
Figure 3 Proteasome subunit activity in mesothelial and fibroblast cell lines. Figure 3 shows relative luminescence units on the y axis. Higher values indicate higher activity of the respective subunit. On the x axis, the investigated cell lines are depicted. Each subunit was measured six times per cell line and error bars indicate the deviation (A–C). Met-5A and MSTO-211H showed elevated activity compared to the other cell lines. (D) Summarizes the correlated results for the subunit activity and respective cell lines. Error bars were spared to enhance the readability.
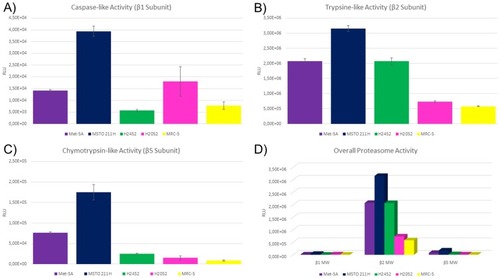
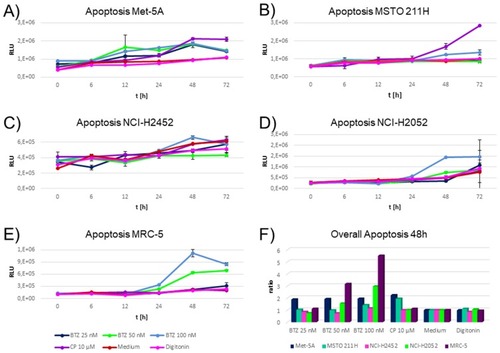
Figure 4 Time-dependent induction of apoptosis in cell lines during incubation with cytostatics and medium. (A-E) shows relative luminescence units on the y axis. Higher values indicate higher caspase 3/7 activity indicating a higher apoptotic rate. The x axis depicts the time points investigated. The different colors indicate the cytostatics applied as explained in the figure legend. BTZ abbreviates bortezomib and CP cisplatin. Triplicates were measured per drug, time point and cell line. Highest induction of apoptosis by bortezomib was monitored for cell lines NCI-H2052 and MRC-5 (D–E). These cell lines were not influenced by cisplatin. Met-5A (A) responded similar to all cytostatics. MSTO-211H showed an elevated induction of apoptosis for cisplatin, but a negligible response to all other drugs and concentrations (B). NCI-H2452 showed a slight response to the highest concentration of bortezomib (100 nM) only (). (F) An optimal time point for each cell status assay was calculated by taking the cells incubated with medium as the baseline and calculating a ratio of the other compounds compared to cells with the medium. The optimal time point was 48 hrs after incubation. On the y axis, the normalized apoptosis ratios for each cell lines are shown. High responses for bortezomib 50 nM and 100 nM were found for MRC-5 and NCI-H2052 only.