Figures & data
Table 1 Clinical and pathological data
Figure 1 Flowchart of cohort recruitment.
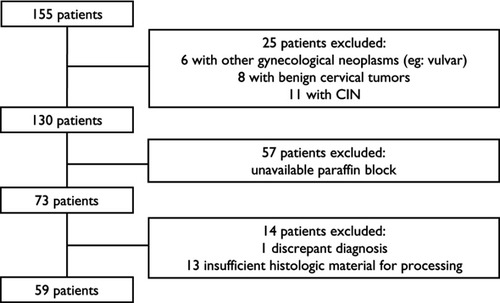
Figure 2 Immunohistochemical staining of PD-L1 was considered positive if cell membrane staining was detected, and FoxP3 staining was considered positive if nuclear staining was detected. Black arrows point to staining detection areas. PD-L1-positive squamous cell cervical neoplasia (A); 400× magnification. PD-L1-positive peritumoral inflammatory infiltrate (B); 400× magnification. FoxP3-positive squamous cell cervical neoplasia (C); 200× magnification. FoxP3-positive peritumoral inflammatory infiltrate (D; 400× magnification).
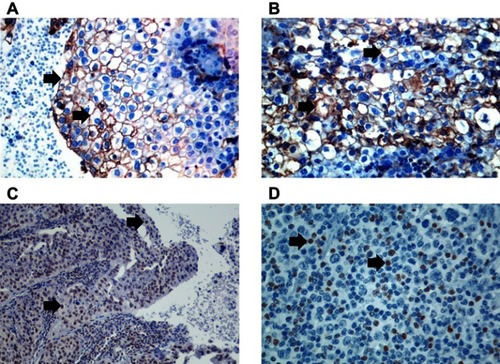
Figure 3 Kaplan–Meier curves and log-rank test analysis of the overall survival of patients with cervical neoplasia based on PD-L1 expression.
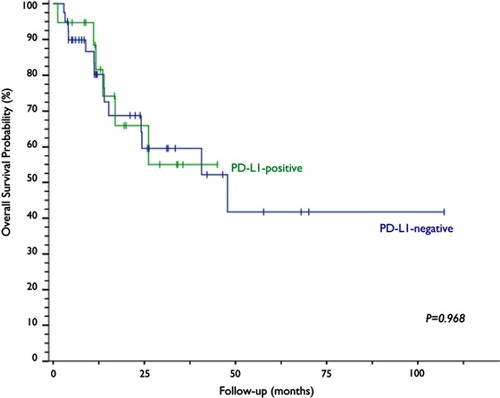
Figure 4 Kaplan–Meier curves and log-rank test analysis of the progression-free survival of patients with cervical neoplasia based on PD-L1 expression.
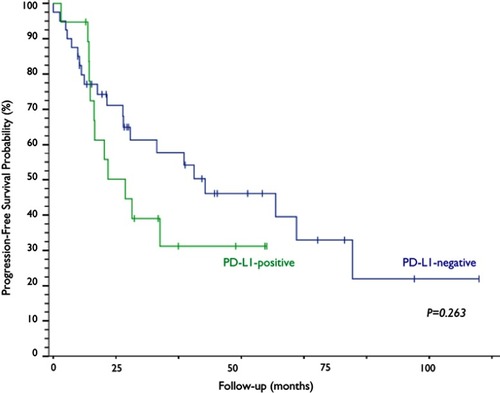
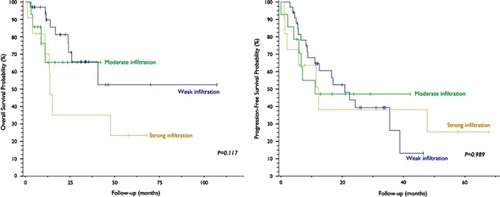
Figure 5 Kaplan–Meier curves and log-rank test analysis of overall survival (left) and progression-free survival (right) of patients with cervical neoplasia based on quantification of peritumoral lymphocytic infiltration.