Figures & data
Figure 1 Evaluation of the lentivirus transduction rate, which was calculated by cellular enumeration under an inverted fluorescence microscope (magnification, ×200). (A) NC group; (B) CD166-shRNA group.
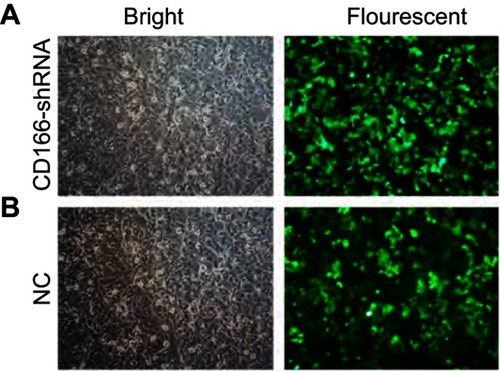
Figure 2 CD166 was downregulated in the CNE-2R cell lines. (A) The analysis of CD166 mRNA expression in respective groups was conducted by RT-qPCR. (B) Western blot analysis showing CD166 expression in different groups. *P<0.01, the CD166-shRNA group compared with the NC group and control group.
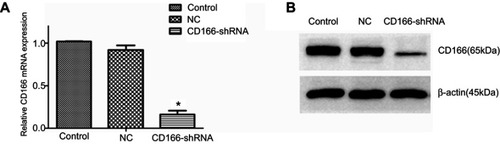
Figure 3 Silencing of CD166 inhibited the migration and invasion of CNE-2R cells. Notes: (A and B) Wound-healing assay to compare cell migration and invasion in the CD166-shRNA group, NC group, and control group (magnification, ×100). (C and E) The effects of silencing of CD166 on cell migration detected by transwell assay, (D and F) Effects of silencing of CD166 on cell invasion detected by transwell assay, (magnification ×200). *P<0.05, the CD166-shRNA group compared with the NC group and control group.
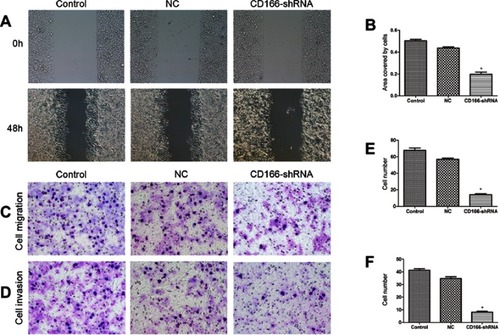
Figure 4 Silencing of CD166 decreased EMT in CNE-2R cells. (A) After CD166 was silenced in CNE-2R cells, E-cadherin was upregulated, and N-cadherin was downregulated as proved by Western blot analysis. (B) Schematical representation of N-cadherin, E-cadherin, and vimentin expression. *P<0.05, the CD166-shRNA group compared with the NC group and control group.
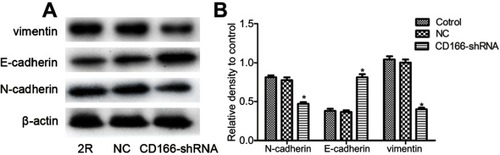
Figure 5 Effects of silencing of CD166 in xenograft nude mouse model. (A) Nude mice used in the experiment. (B) Tumor obtained from nude mice. (C) Growth curve of xenograft tumors of nude mice.
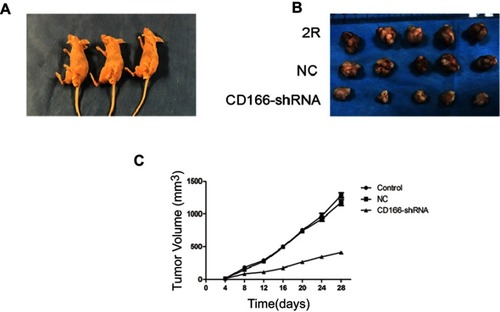
Figure 6 Expression of CD166 and EMT-related protein of nude mice xenograft model with the downregulation of CD166. (A–C) IHC suggested that E-cadherin was upregulated, while N-cadherin and vimentin were downregulated (magnification, ×200). (D) CD166 expression of nude mouse xenograft model identified by IHC. (E and F) CD166 expression of nude mouse xenograft model identified by Western blotting. *P<0.05, the CD166-shRNA group compared with the NC group and control group.
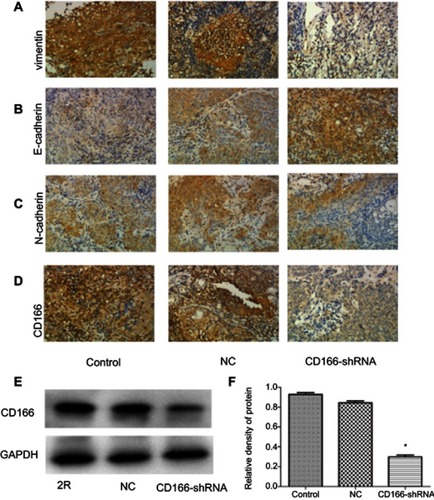
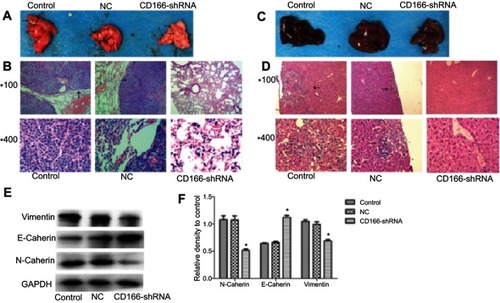
Figure 7 The effects of silencing of CD166 on tumor cell metastasis in vivo. (A and C) Representative metastatic lung tissue and liver tissue of the three groups, (B and D) H&E staining morphology of the lung metastatic tumors (magnifications, ×100 and ×400). (E and F) E-cadherin was upregulated, whereas N-cadherin and vimentin were downregulated in the metastatic lung tissue detected by Western blot analysis. *P<0.05, the CD166-shRNA group compared with the NC group and control group.