Figures & data
Figure 1 GNL3 is up-regulated in SARCs and its up-regulation is associated with poor prognosis of patients with sarcoma.
Notes: (A) The expression of GNL3 mRNA in sarcoma tissues (red box) and normal tissues (black box) by GEPIA databases. The y-axis indicates the log2-transformed gene expression level. (B) Survival percentage of sarcoma patients with high or low expression of GNL3 mRNA by GEPIA databases. Blue: patients with low expression of GNL3; Red: patients with high expression of GNL3. *P<0.05.
Abbreviations: SARC, sarcoma tissue; TPM, trans per million.
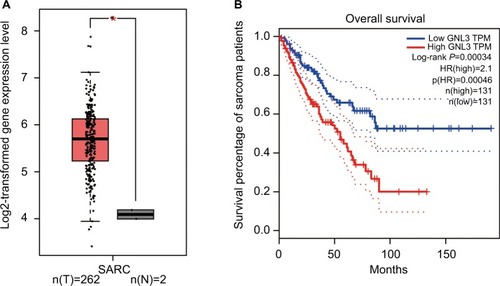
Figure 2 GNL3 knockdown inhibits cell viability and colony formation in osteosarcoma cells.
Notes: (A, B) The expression of GNL3 in normal chondrocyte and osteosarcoma cell lines MG63 and U20S was measured by Real-time PCR (A) and Western blot (B). Four siRNA-GNL3 sequences (1#-4#) were transfected into osteosarcoma cell lines MG63 and U20S cells as GNL3 silencing group (si-GNL3), respectively, scrambled siRNA was used as NC. After 24 hours of transfection (C, D). The relative expression of GNL3 mRNA in MG63 (A) and U20S (B) cells was examined by RT-PCR. (E) After 48 hours of transfection, the expression of GNL3 protein in MG63 and U20S cells was examined by Western blot assay. After transfection, cell viability in MG63 (F) and U20S (G) cells was determined by CCK8 assay. (H) Colony formation ability of MG63 and U20S cells was determined using colony formation assay. GNL3-KD, GNL3 knockdown, cells transfected with siRNA-GNL3. Data are expressed as the mean±SD (n=3). Results were obtained in three separate experiments. *P<0.05, **P<0.01 vs the control group.
Abbreviations: NC, negative control; RT-PCR, real-time PCR.
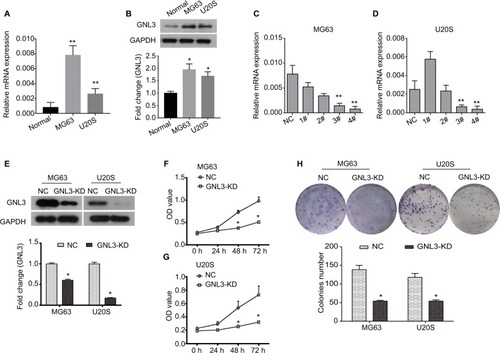
Figure 3 GNL3 knockdown inhibits migration and invasion in osteosarcoma cells.
Notes: (A, B) After 24 hours of transfection, a wound-healing assay was performed to detect the effect of si-GNL3 on cell migration in MG63 and U20S cells. Magnification ×40. (C, D) Transwell assay was employed to assess the effect of si-GNL3 on the cell invasion ability of MG63 and U20S cells. Magnification ×100. Data are presented as the mean±SD (n=3). Results were obtained in three replicates. *P<0.05 vs the control group.
Abbreviation: NC, negative control.
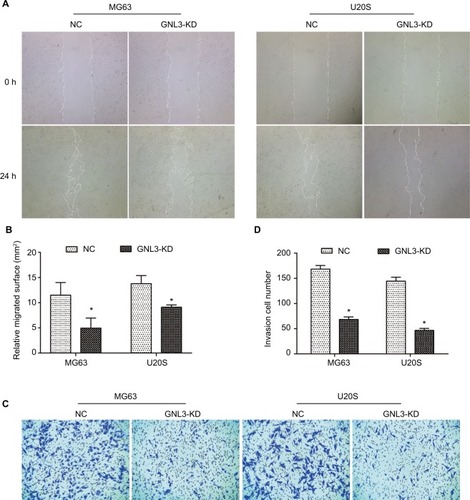
Figure 4 GNL3 knockdown induces cell cycle arrest and promotes apoptosis in osteosarcoma cells.
Notes: (A, B, C) Flow cytometry analyses were applied to test the effects of si-GNL3 on cell cycle distribution in MG63 and U20S cells. (D, E) Cell apoptosis was also assessed by flow cytometry in MG63 and U20S cells. (F) Hoechst/PI staining assay was used to observe the effect of si-GNL3 on cell apoptosis in MG63 and U20S cells. Magnification ×100. (G) After 48 hours of transfection, Western blot assays of apoptosis-related proteins (cleaved Caspase3 and cleaved Caspase9) were conducted in MG63 and U20S cells. Data are presented as the mean±SD (n=3). Results were obtained in three replicates. *P<0.05, **P<0.01 vs the control group.
Abbreviations: NC, negative control; PI, propidium iodide.
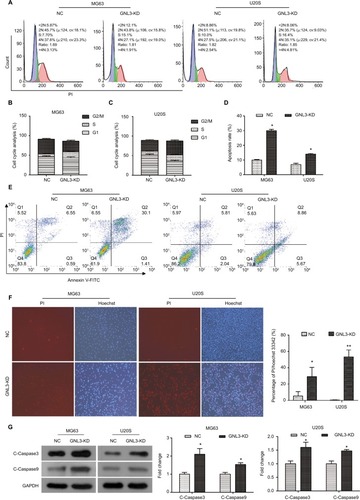
Figure 5 GNL3 knockdown diminishes the MMP9 and EMT process in osteosarcoma cells.
Notes: After transfection, the MMP9 activity was examined by gelatin zymography enzyme activities assay (A). Changes in the expression of marker proteins (E-cadherin and N-cadherin) in the EMT process were detected by Western blot (B). Data are expressed as the mean±SD from three independent experiments. *P<0.05 vs the control group.
Abbreviations: EMT, epithelial–mesenchymal transition; NC, negative control.
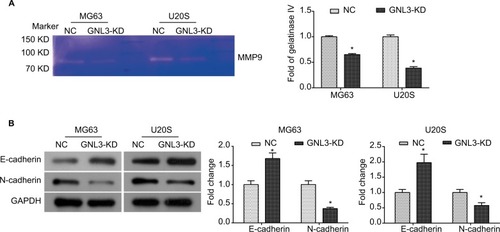
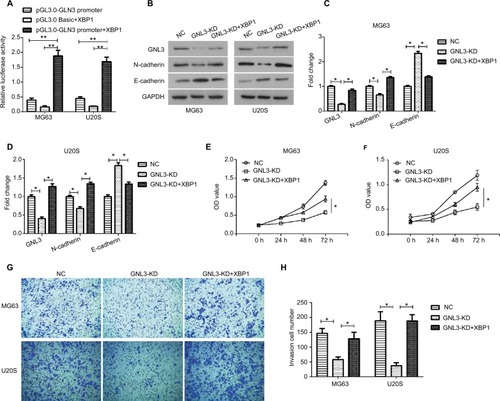
Figure 6 XBP1 binds to GNL3 in osteosarcoma cells.
Notes: (A) The pGL3.0-GNL3-promoter or pGL3.0 Basic vector was constructed to co-transfect with pcDNA3.1-XBP1 vector into MG63 and U20S cells, and pGL3.0-GNL3-promoter was used as control. After co-transfection, dual-luciferase reporter assay was used to assess the relative luciferase activity in MG63 and U20S cells. The si-GNL3 was co-transfected with pcDNA3.1-XBP1 into MG63 and U20S cells. After co-transfection, Western blot was used to detect the expression of GNL3, N-cadherin, and E-cadherin (B, C, and D). (E, F) CCK8 assay was used to assess the effect of XBP1 on cell viability in MG63 (E) and U20S (F). (G, H) Transwell assay was employed to assess the effect of XBP1 on cell invasion ability of MG63 and U20S cells. Magnification ×100. Data are presented as mean±SD (n=3). Results were obtained in three replicates. *P<0.05, **P<0.01 vs the control group.
Abbreviations: NC, negative control; XBP1, X-box-binding protein 1.