
Figures & data
Figure 1 Flowchart of study group inclusion process.
Abbreviations: DWI, diffusion-weighted imaging; MR, magnetic resonance; MRI, magnetic resonance imaging; PNETs, pancreatic neuroendocrine tumors.
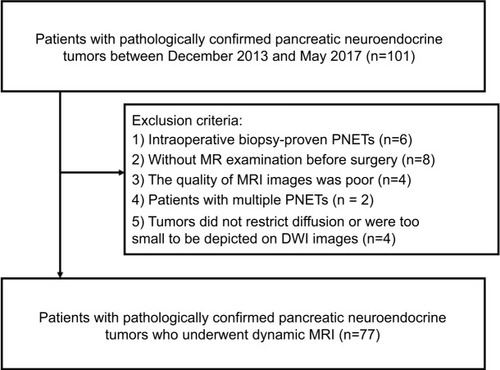
Figure 2 Example of T2WI images showing segmentation of pancreatic neuroendocrine tumors.
Notes: Manual segmentation of the tumor was delineated by stacking up regions of interest slice-by-slice on the axial T2WI images (A). Histogram of the tumor on T2WI images (B).
Abbreviation: T2WI, T2-weighted imaging.
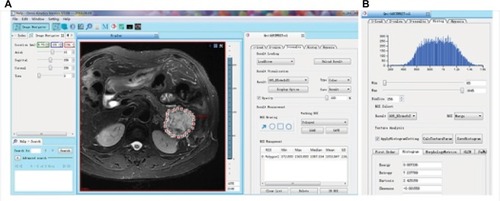
Table 1 Demographic characteristics of patients with pancreatic neuroendocrine tumors (PNETs)
Figure 3 Magnetic resonance images of a 58-year-old woman with pancreatic neuroendocrine tumor Grade 1.
Notes: Fat-suppressed liver acquisition with volume acceleration sequence. T1-(A) and T2-(B) weighted imaging, a well-defined mass (arrows) located in the uncinate process of pancreas shows hypo-intensity and hyper-intensity, respectively. Diffusion-weighted images shows the tumor (arrow) was isointense (C). The tumor (arrows) shows persistent hyper-enhancement during the arterial (D), portal venous (E), and delayed (F) phase.
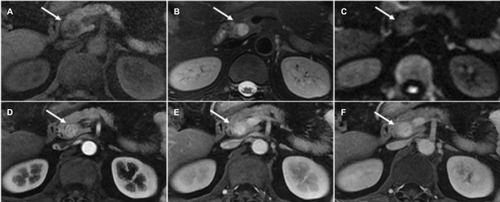
Figure 4 Magnetic resonance images of a 64-year-old woman with pancreatic neuroendocrine tumor Grade 3.
Notes: Fat-suppressed liver acquisition with volume acceleration sequence. T1-(A) and T2-(B) weighted imaging, a well-defined mass (arrows) located in the body of pancreas shows hypo-intensity and slight hyper-intensity, respectively. Diffusion-weighted images shows the tumor (arrow) was hyper-intense (C). The tumor (arrows) shows persistent hypo-enhancement during the arterial (D), portal venous (E), and delayed (F) phase.
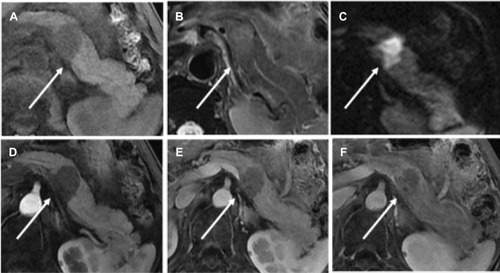
Table 2 Magnetic resonance imaging findings and signal intensity of pancreatic neuroendocrine tumors based on tumor grade
Table 3 Multivariate logistic regression models for prediction of pancreatic neuroendocrine tumor grade with T2WI texture features
Table 4 Multivariate logistic regression models for prediction of pancreatic neuroendocrine tumor grade with DWI texture features
Figure S1 ROC curves of the multivariate logistic regression models for prediction of PNET grade with T2WI (A, Grade 1 vs Grade 2; B, Grade 1 vs Grade 3; C, Grade 2 vs Grade 3) and DWI (D, Grade 1 vs Grade 2; E, Grade 1 vs Grade 3; F, Grade 2 vs Grade 3) texture features. The AUCs are 0.833, 0.989, 0.813, 0.841, 0.962, and 0.703, respectively.
Abbreviations: PNET, pancreatic neuroendocrine tumors; T2WI, T2-weighted imaging; DWI, diffusion-weighted imaging.
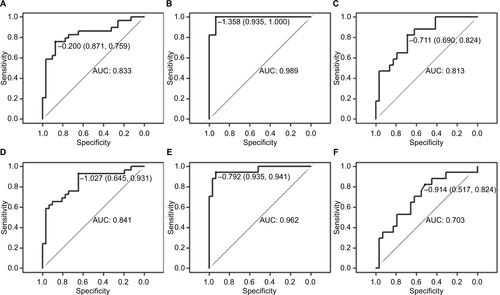
Table S1 Comparisons of T2WI texture features among pancreatic neuroendocrine tumors (P-values, Kruskal–Wallis test with Bonferroni correction)
Table S2 Comparisons of DWI texture features among pancreatic neuroendocrine tumors (P-values, Kruskal–Wallis test with Bonferroni correction)