
Figures & data
Table 1 Distribution of parotid gland cancers
Table 2 Association between neutrophil-to-lymphocyte ratio and clinical pathologic variables
Figure 1 Disease-specific survival in patients with different NLRs.
Note: P=0.006.
Abbreviation: NLR, neutrophil-to-lymphocyte ratio.
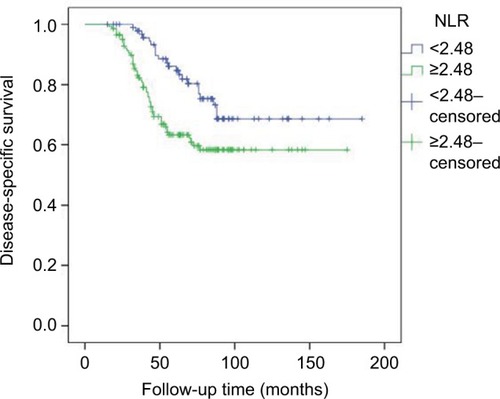
Table 3 Univariate and multivariate analysis of the predictors for disease-specific survival in patients with parotid cancer