Figures & data
Figure 1 SLC5A1 was over-expressed in human pancreatic cancer and associated with poor prognosis. (A) Comparison of mRNA expressions of SLC5A1 and SLC5A2 between human pancreatic tumor tissues and normal tissue. Increased SLC5A1 and reduced SLC5A2 were observed in pancreatic tumor tissue as compared to normal tissue. (B) Kaplan-Meier plots of overall and disease-free survival in pancreatic cancer patients with low SLC5A1 and high SLC5A1. Patients with high SLC5A1 is associated with reduced overall survival. (C) Kaplan-Meier plots of overall and disease-free survival in pancreatic cancer patients with other SGLTs expression. There is no significant correlation in SGLTs expression with patients’ overall and disease-free survival rate. **P<0.01, ***P<0.0001.
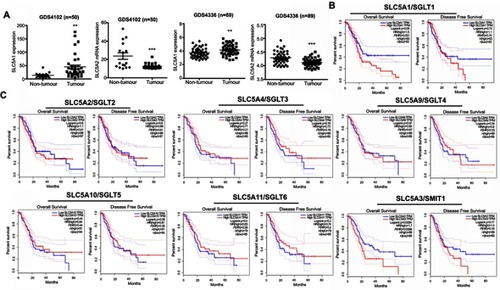
Figure 2 SLC5A1 blockade suppressed pancreatic cell growth. (A) The mRNA of SGLTs in pancreatic cancer Panc-1 cells. Only the mRNA level of SGLT1 (SLC5A1) and SMIT1 (SLC5A3) showed relative high level of expression in Panc-1 cells. (B) the mRNA expression and (C) the protein expression of SLC5A1 and SLC5A3 in different pancreatic cancer cell lines and normal pancreatic cancer cells. SLC5A1 but not SLC5A3 was overexpressed in pancreatic cancer cells compared to normal cells. (D) Expressions of SLC5A1 in Panc-1 and Panc-2 cells were silenced by shRNA and validated by qPCR and immunoblotting. (E) Panc-1 and Panc-2 cells transfected with shSLC5A1 or scramble control were seeded, and cell number was counted every two days for 10 days. Inhibition of SLC5A1 reduced pancreatic cell growth. A non-selective SGLT1 inhibitor phlorizin, showed similar effects to SLC5A1 knockdown. (F) Cell cycle distribution analysis of 72 hours-cultured Panc-1 and Panc-2 cells with or without SLC5A1 knockdown. Inhibition of SLC5A1 arrested the pancreatic cancer cell lines at G0/G1 phase. A non-selective SGLT1 inhibitor phlorizin, showed similar effects to SLC5A1 knockdown. (G) SLC5A1 knockdown Panc-1 and Panc-2 cells showed reduced clonogenic survival compared to control cells. A non-selective SGLT1 inhibitor phlorizin, showed similar effects to SLC5A1 knockdown. *P<0.05, **P<0.01, ***P<0.0001.
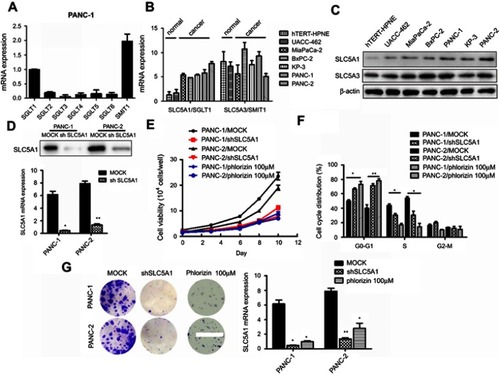
Figure 3 Silencing of SLC5A1 reduced in vivo pancreatic cancer growth. (A) Representative images of Panc-2-implanted mice captured every week throughout 3 weeks of experiment. Knockdown of SLC5A1 decreased in vivo tumor growth. (B) Kaplan-Meier survival plots of mice implanted with Panc-2 with or without SLC5A1 knockdown. Knockdown of SLC5A1 enhanced mice survival. (C) Weekly monitoring of body weight of mice. There were no significant changes in body weight throughout the study period. (D) The weight of tumour-bearing pancreas was reduced in mice implanted with SLC5A1 knockout Panc-2. **P<0.01.
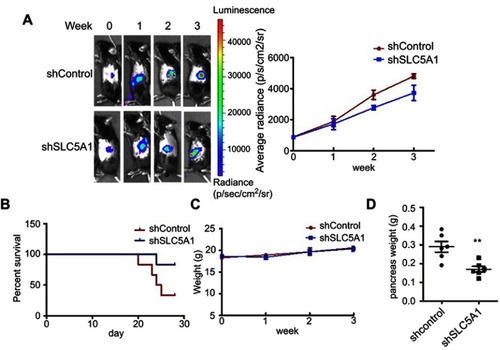
Figure 4 Inhibition of SLC5A1 suppressed glucose uptake of pancreatic cancer cells. (A) Comparison of histogram from flow cytometry analysis. Knockdown of SLC5A1 reduced uptake of 2-NBDG by cancer cells. (B) Cells with or without SLC5A1 inhibition were cultured with 0.5 mM, 5 mM and 50 mM of glucose and cell viability was determined after 72 hours. 50 mM of glucose culture recovered the cell death induced by SLC5A1 inhibition. *P<0.05, **P<0.01, ***P<0.0001.
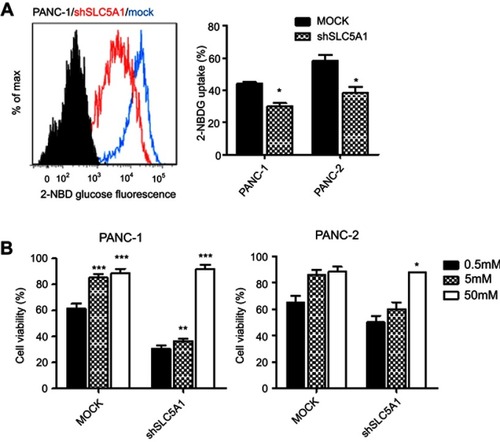
Figure 5 SLC5A1-regulated cancer cell growth is dependent on AMPK/mTOR signaling. (A) Immunoblotting analysis of phosphorylated-AMPK and mTOR with cell lysates from Panc-2 with or without SLC5A1 blockade and cultured with 0.5 mmol/L-glucose. Protein expression of phosphorylated-AMPK was increased while phosphorylated-MTOR was decreased in SLC5A1 blockade cells. (B) Pretreatment with compound C (1 μM) recovered the viability of SLC5A1 knockdown pancreatic cancer cells. (C) Compound C diminished the prolonged G0/G1 arrest induced in SLC5A1 knockdown Panc-1 and Panc-2 cells. (D) Compound C recovered the clonogenic survival in SLC5A1 knockdown Panc-1 and Panc-2 cells. *P<0.05.
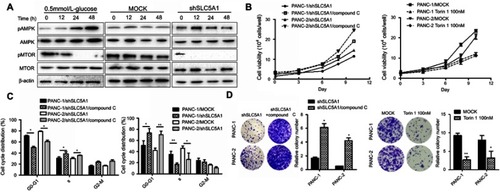
Figure 6 The association of SLC5A with EGFR mediates pancreatic cancer cell growth. (A) SLC5A1 is closely co-related with EGFR with a confidence score of 0.38. (B) The positive correlation between SLC5A1 and EGFR mRNA expressions. (C) co-immunoprecipitation assay showing the interaction between SLC5A1 and EGFR protein. (D) Immunoblotting analysis of SLC5A1 with cell lysates from cells transfected with siEGFR or scrambles negative control. Protein expression of SLC5A1 was reduced consistently in EGFR knockdown cells. (E) Knockdown of EGFR decreased uptake of 2-NBDG by cancer cells. (F) Knockdown of EGFR reduced cancer cell viability as compared to mock cells. Torin 1, a mTOR inhibitor, showed similar effect to EGFR knockdown on cell viability. (G) Immunoblotting analysis of phosphorylated-AMPK and mTOR with cell lysates from EGFR knockdown cells. Protein expression of p-AMPK was increased while p-mTOR was reduced in EGFR knockdown cells. **P<0.01.
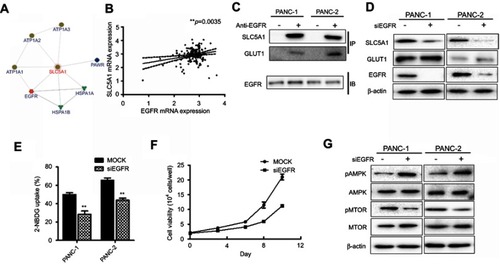
Figure 7 Reduced co-expressions of SLC5A1 with EGFR suppressed pancreatic cancer cell growth through AMPK/mTOR signaling.
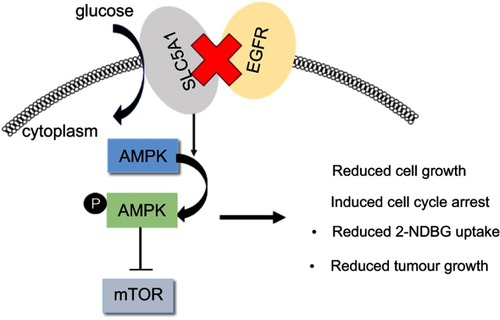
Figure S1 Kaplan-Meier plots of overall and disease-free survival in pancreatic cancer patients with low GLUTs and high GLUTs. Patients with high GLUT1 but not GLUT2-4 is associated with reduced overall survival.
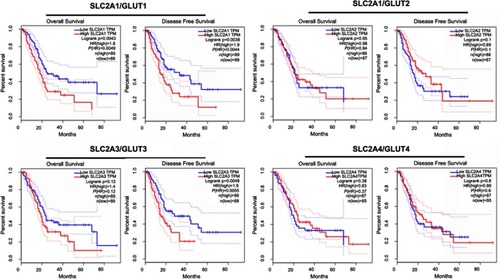
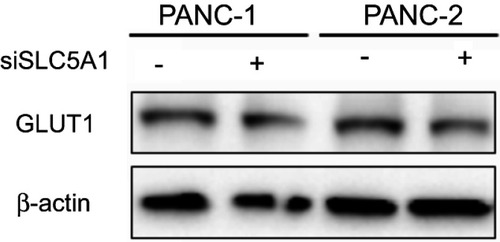
Figure S2 Knockdown of SLC5A1 has no significant effect on GLUT1 expression. Panc-1 and Panc-2 cells expressing siRNA against SLC5A1 was collected for immunoblotting. No significant change on GLUT1 expression in both cells was observed after SLC5A1 knockdown.