Figures & data
Table 1 Characteristics of study subjects with ESCC for validation
Figure 1 Expression of hsa_circ_0000337 in ESCC tissues and cell lines.
Notes: (A) The Wilcoxon signed-rank test showed that the expression of hsa_circ_0000337 in cancer tissues was upregulated compared to matched adjacent normal-appearing tissues. (B) The expression of hsa_circ_0000337 in the esophageal carcinoma cell line TE-1 was higher than that in the normal human esophageal epithelial cell line HET-1A, but was not significantly changed in KYSE-150. (C) There was a slight upward trend when comparing clinical samples with poor to well differentiation grades. The three lines in (A) and (C) represent the median with interquartile ranges. 1: moderate-poor or poor differentiation; 2: moderate differentiation; ands3: well-to-moderate or well-differentiation. **P<0.01.
Abbreviations: ESCC, esophageal squamous cell carcinoma; N, adjacent normal-appearing tissue; T, cancer tissue.
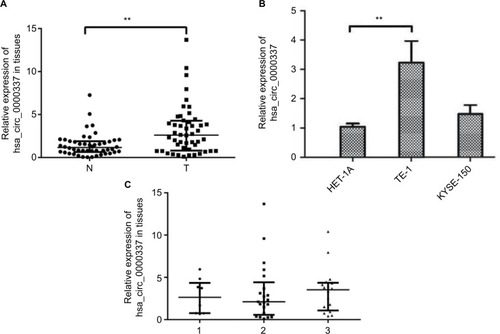
Figure 2 Knockdown of hsa_circ_0000337 using siRNAs.
Notes: (A) The expression of hsa_circ_0000337 was significantly downregulated in the TE-1 cell line after transfection by siRNA1 and siRNA3. (B) The expression of hsa_circ_0000337 was significantly downregulated in the KYSE-150 cell line after transfection by siRNA1, siRNA2, and siRNA3. **P<0.01.
Abbreviation: NC, negative control.
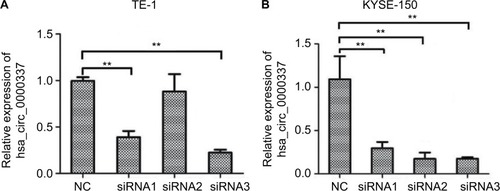
Figure 3 Knockdown of hsa_circ_0000337 inhibits the proliferation, migration, and invasion of ESCC cells.
Notes: The CCK-8 and colony formation assay showed that knockdown of hsa_circ_0000337 inhibited proliferative activity in both (A) TE-1 and (B) KYSE-150 cell lines. The wound healing assay showed that knockdown of hsa_circ_0000337 suppressed the migration of (C) TE-1 and (D) KYSE-150 cell lines. The Transwell assay showed that knockdown of hsa_circ_0000337 inhibited the invasion of (E) TE-1 and (F) KYSE-150 cell lines. *P<0.05 and **P<0.01.
Abbreviations: CCK-8, Cell Counting Kit-8; ESCC; esophageal squamous cell carcinoma; NC, negative control.
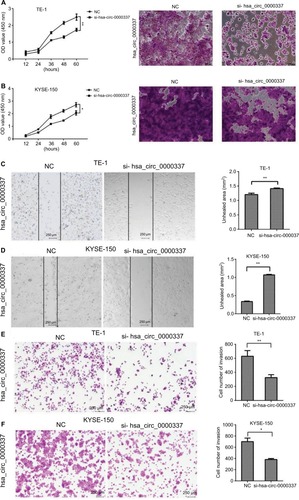
Figure 4 hsa_circ_0000337 serves as a sponge for miR-670-5p.
Notes: (A) The binding sites for miR-670-5p in hsa_circ_0000337. (B) The luciferase intensity decreased after cotransfection with hsa_circ_0000337 wild-type and has-miR-670-5p mimics in TE-1 cell lines. (C) The luciferase intensity decreased after cotransfection with hsa_circ_0000337 wild-type and hsa-miR-670-5p mimics in KYSE-150 cell lines. *P<0.05 and **P<0.01.
Abbreviations: NC, negative control; mut, mutant type; wt, wild-type.
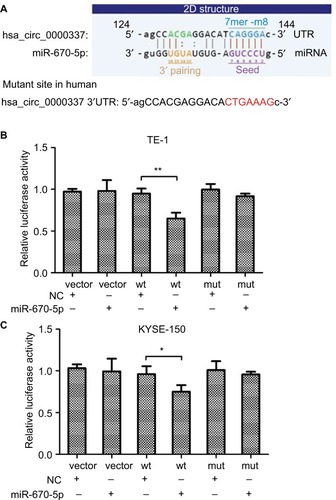
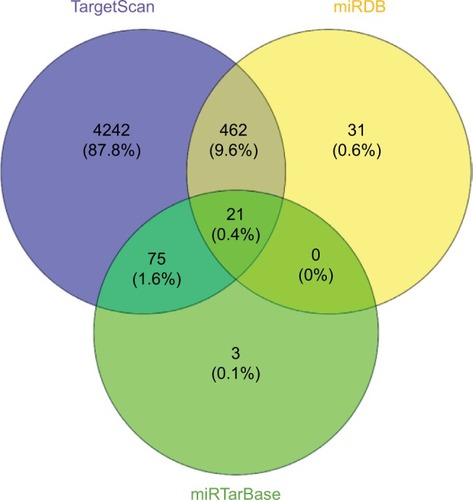
Figure 5 Predicted genes targeted by miR-670-5p.