
Figures & data
Table 1 Clinicopathologic characteristics and prognosis of patients
Table 2 Association analysis between clinicopathologic characteristics and VPI
Table 3 Multivariate logistic regression analysis between EGFR mutations and clinicopathologic characteristics
Figure 1 DFS curve analysis for postoperative patients based on VPI and EGFR mutations.
Notes: (A) DFS curves in VPI and non-VPI groups. (B) DFS curves in EGFR wild-type and EGFR mutation groups. (C) DFS curves in non-VPI patients stratified by EGFR mutations. (D) DFS curves in VPI patients stratified by EGFR mutations. (E) DFS curves in EGFR wild-type patients stratified by VPI. (F) DFS curves in EGFR mutation patients stratified by VPI.
Abbreviations: DFS, disease-free survival; VPI, visceral pleural invasion.
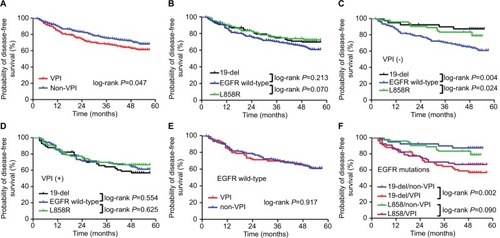
Table 4 DFS analysis in non-VPI and VPI groups
Figure S1 Five types of tumor–pleural surface relationship.
Notes: (A) No contacting, (B) abutting pleural, (C) pleural tag type I, (D) pleural tag type II, and (E) pleural tag type III. The red arrows illustrate the five types of tumor–pleural surface relationship on CT images.
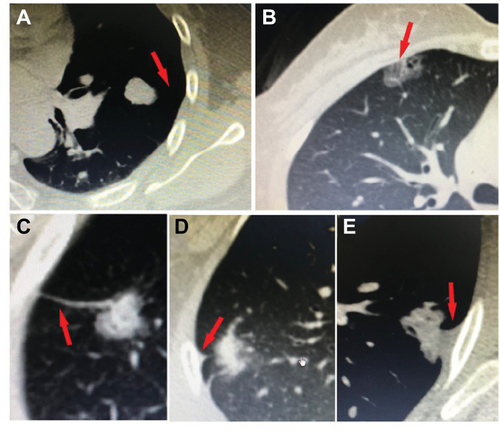
Table S1 Association analysis between EGFR mutations and clinicopathologic characteristics
Table S2 Association analysis between EGFR 19-del and clinicopathologic characteristics
Table S3 Association analysis between EGFR L858R and clinicopathologic characteristics