
Figures & data
Table 1 Patient characteristics
Figure 1 Schematic representation of needle track design (A) and 3D-printed minimally invasive-guided template (B).
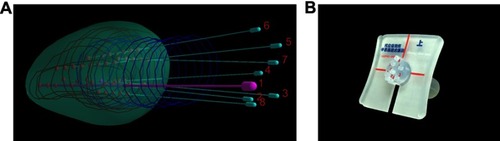
Figure 2 3D printed minimally invasive guidance template implantation (A) and 3D model after reconstruction of tumor target volume and organs at risk (B). Red refers to the tumor target volume, blue refers to the bladder, yellow refers to the rectum, and pink indicates the sigmoid colon.
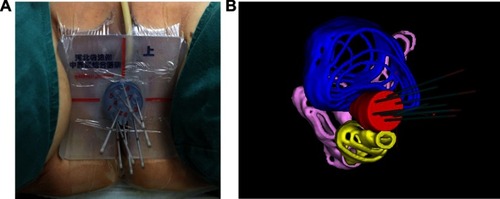
Table 2 Therapeutic parameters of the target volume (mean±SD)
Table 3 Therapeutic parameters of the organs at risk (mean±SD)
Table 4 Number of CT scans, time for insertion, and number of needles used