60
Views
22
CrossRef citations to date
0
Altmetric
Original Research

Long noncoding RNA H19 is a critical oncogenic driver and contributes to epithelial-mesenchymal transition in papillary thyroid carcinoma

, , , , , & show all
Pages 2059-2072 | Published online: 06 Mar 2019

Figures & data

Figure 1 Analysis of lncRNA H19 expression in PTC patients according to qRT-PCR.

Notes: (A) Relative expression of H19 in cancer group and paracancerous group. (B) Relative expression of H19 in T<1.5 cm group and T≥1.5 cm group. (C) Relative expression of H19 in non-metastasis group and lymph node metastasis group. (D) Relative expression of H19 in stage I+II group and stage III+IV group (*P<0.05, **P<0.01, and ***P<0.001).

Abbreviations: lncRNA H19, long noncoding RNA H19; PTC, papillary thyroid carcinoma; qRT-PCR, quantitative real-time PCR.
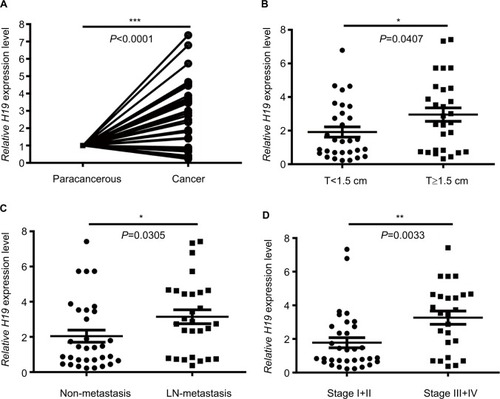
Figure 1 Analysis of lncRNA H19 expression in PTC patients according to qRT-PCR.Notes: (A) Relative expression of H19 in cancer group and paracancerous group. (B) Relative expression of H19 in T<1.5 cm group and T≥1.5 cm group. (C) Relative expression of H19 in non-metastasis group and lymph node metastasis group. (D) Relative expression of H19 in stage I+II group and stage III+IV group (*P<0.05, **P<0.01, and ***P<0.001).Abbreviations: lncRNA H19, long noncoding RNA H19; PTC, papillary thyroid carcinoma; qRT-PCR, quantitative real-time PCR.

Table 1 Clinicopathological characteristics of 58 PTC patients according to H19 expression

Figure 2 H19 expression was significantly correlated with ZEB2 expression in thyroid carcinoma (shown in red frame, from ONCOMINE correlation analysis).
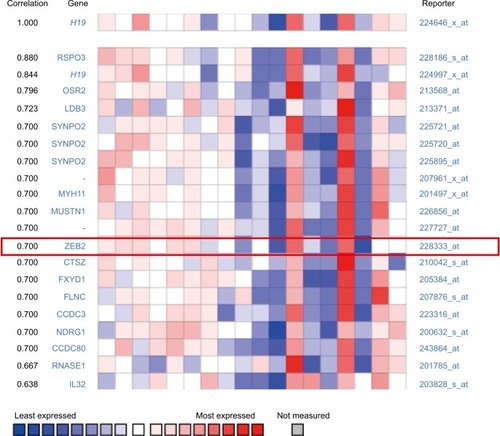
Figure 2 H19 expression was significantly correlated with ZEB2 expression in thyroid carcinoma (shown in red frame, from ONCOMINE correlation analysis).

Figure 3 Elevated H19 expression correlated with higher expression of Vimentin, ZEB2, Twist, and Snail2 in thyroid carcinoma.

Notes: In the TCGA (the Cancer Genome Atlas) database, the Pearson’s chi-squared test was performed to analyze the correlation of H19 and some typical mesenchymal markers. (A and B) Gene correlation targeted analysis between H19 and Vimentin in samples of (A) thyroid carcinoma or (B) PTC. (C and D) Gene correlation targeted analysis between H19 and ZEB2 in samples of (C) thyroid carcinoma or (D) PTC. (E and F) Gene correlation targeted analysis between H19 and Twist in samples of (E) thyroid carcinoma or (F) PTC. (G and H) Gene correlation targeted analysis between H19 and Snail2 in samples of (G) thyroid carcinoma or (H) PTC.

Abbreviation: PTC, human papillary thyroid carcinoma.
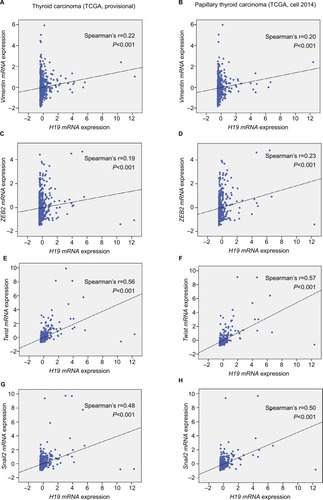
Figure 3 Elevated H19 expression correlated with higher expression of Vimentin, ZEB2, Twist, and Snail2 in thyroid carcinoma.Notes: In the TCGA (the Cancer Genome Atlas) database, the Pearson’s chi-squared test was performed to analyze the correlation of H19 and some typical mesenchymal markers. (A and B) Gene correlation targeted analysis between H19 and Vimentin in samples of (A) thyroid carcinoma or (B) PTC. (C and D) Gene correlation targeted analysis between H19 and ZEB2 in samples of (C) thyroid carcinoma or (D) PTC. (E and F) Gene correlation targeted analysis between H19 and Twist in samples of (E) thyroid carcinoma or (F) PTC. (G and H) Gene correlation targeted analysis between H19 and Snail2 in samples of (G) thyroid carcinoma or (H) PTC.Abbreviation: PTC, human papillary thyroid carcinoma.

Figure 4 H19 regulates expression of EMT marker E-cadherin and Vimentin in PTC cells.

Notes: (A and B) Expression of E-cadherin and Vimentin in B-CPAP cells at protein and mRNA levels analyzed by (A) Western blot and (B) RT-PCR, respectively, when silencing H19 by siH19-a and siH19-b. (C and D) Expression of E-cadherin and Vimentin in B-CPAP cells at protein and mRNA levels analyzed by (C) Western blot and (D) RT-PCR, respectively, when overexpressing H19. *P<0.05 as compared to control groups.

Abbreviations: EMT, epithelial-mesenchymal transition; PTC, papillary thyroid carcinoma; RT-PCR, real-time PCR.
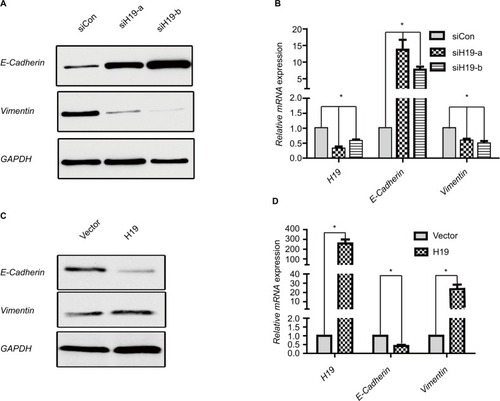
Figure 4 H19 regulates expression of EMT marker E-cadherin and Vimentin in PTC cells.Notes: (A and B) Expression of E-cadherin and Vimentin in B-CPAP cells at protein and mRNA levels analyzed by (A) Western blot and (B) RT-PCR, respectively, when silencing H19 by siH19-a and siH19-b. (C and D) Expression of E-cadherin and Vimentin in B-CPAP cells at protein and mRNA levels analyzed by (C) Western blot and (D) RT-PCR, respectively, when overexpressing H19. *P<0.05 as compared to control groups.Abbreviations: EMT, epithelial-mesenchymal transition; PTC, papillary thyroid carcinoma; RT-PCR, real-time PCR.

Figure 5 H19 knockdown in B-CPAP cells inhibits EMT while overexpression promotes EMT.

Notes: (AC) Wound healing assay showed the knockdown of H19 inhibited the cellular motility of B-CPAP cells, while overexpression of H19 enhanced such motility. (A) Representative pictures and (B and C) quantitative data of wound recovery after 48 hours cell culture. Each sample contained three wells. (DG) Knockdown of H19 decreased the cellular migration and invasion of B-CPAP cells; while overexpression of H19 enhanced such motility. (D) Representative pictures of migration and (E) invasion, (F) quantitative data of migration, or (G) invasion assays. All experiments were performed at least thrice and data were statistically analyzed by two-way ANOVA. *P<0.05 vs control. Error bars indicate SD.

Abbreviation: EMT, epithelial-mesenchymal transition.
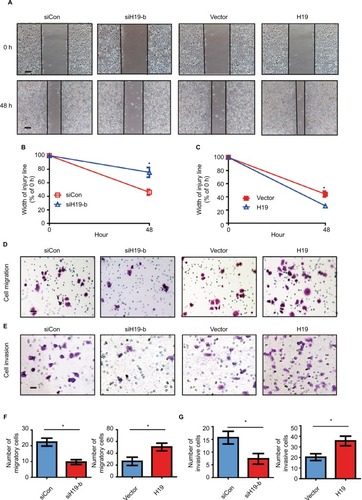
Figure 5 H19 knockdown in B-CPAP cells inhibits EMT while overexpression promotes EMT.Notes: (A–C) Wound healing assay showed the knockdown of H19 inhibited the cellular motility of B-CPAP cells, while overexpression of H19 enhanced such motility. (A) Representative pictures and (B and C) quantitative data of wound recovery after 48 hours cell culture. Each sample contained three wells. (D–G) Knockdown of H19 decreased the cellular migration and invasion of B-CPAP cells; while overexpression of H19 enhanced such motility. (D) Representative pictures of migration and (E) invasion, (F) quantitative data of migration, or (G) invasion assays. All experiments were performed at least thrice and data were statistically analyzed by two-way ANOVA. *P<0.05 vs control. Error bars indicate SD.Abbreviation: EMT, epithelial-mesenchymal transition.

Figure S1 Expression pattern of H19 in different tumor types.

Notes: This figure shows the number of datasets with statistically significant RNA overexpression (red) or down-expression (blue) of the target gene (cancer vs. normal tissue). The P-value threshold is 0.01. The number in each cell represents the number of analyses that meet the threshold within those analysis and cancer types. The gene rank was analyzed by percentile of target gene in the top of all genes measured in each research. Cell color is determined by the best gene rank percentile for the analyses within the cell.
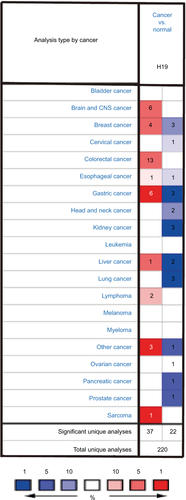
Figure S1 Expression pattern of H19 in different tumor types.Notes: This figure shows the number of datasets with statistically significant RNA overexpression (red) or down-expression (blue) of the target gene (cancer vs. normal tissue). The P-value threshold is 0.01. The number in each cell represents the number of analyses that meet the threshold within those analysis and cancer types. The gene rank was analyzed by percentile of target gene in the top of all genes measured in each research. Cell color is determined by the best gene rank percentile for the analyses within the cell.

Figure S2 The RNA expression level of H19 in thyroid cancer cells ranked eleventh highest in a variety of cancer cell lines from Cancer Cell Line Encyclopedia analysis (shown in red frame).

Abbreviations: RMA, return material authorization; CML, chronic myelocytic leukemia; AML, acute myelocytic leukemia; NSC, non-small cell.
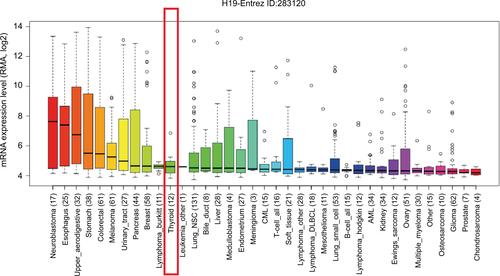
Figure S2 The RNA expression level of H19 in thyroid cancer cells ranked eleventh highest in a variety of cancer cell lines from Cancer Cell Line Encyclopedia analysis (shown in red frame).Abbreviations: RMA, return material authorization; CML, chronic myelocytic leukemia; AML, acute myelocytic leukemia; NSC, non-small cell.

Table S1 Primers used in RT-PCR

Table S2 Oligonucleotide sequences for siRNA constructs

Table S3 Antibodies used in this study