Figures & data
Figure 1 Expression level of lncRNA FEZF1-AS1. (A) The expression of lncRNA FEZF1-AS1 in ESCC tissues (n=45) was higher than the expression of paired adjacent noncancerous tissues; (B) The expression of FEZF1-AS1 was high ein ESCC cell lines compared to the normal esophageal epithelial cells (Het-1A); (C) FEZF1-AS1 was overexpressed in gastrointestinal tumors such as primary esophageal carcinoma (ESCA) and stomach adenocarcinoma (STAD); (D) Relative expression of FEZF1-AS1 was obviously increased in lymphatic metastasis patients compared to the patients without lymphatic metastasis. *P < 0.05, **P < 0.01, ***P < 0.001.
Abbreviations: ESCA, esophageal carcinoma; STAD, stomach adenocarcinoma.
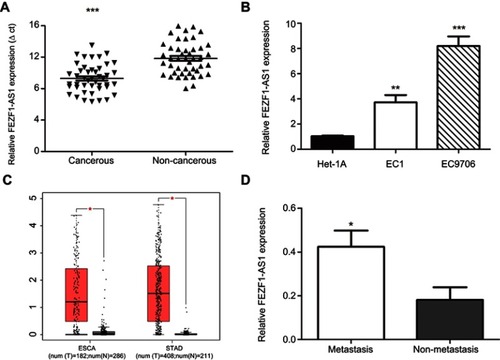
Table 1 The correlation between FEZF1-AS1 expression and clinicopathological factors of ESCC patients
Figure 2 Intracellular expression of FEZF1-AS1 after transfection and the effect of FEZF1-AS1 on proliferation of esophageal cancer cells. (A) FEZF1-AS1 levels of si-FEZF1-AS1#1 and si-FEZF1-AS1#2 groups were notably decreased compared to that in control groups; (B) FEZF1-AS1 levels of FEZF1-AS1 overexpression groups were notably increased compared to that in control groups; (C) silencing of FEZF1-AS1 had no effect on ESCC cell proliferation; (D) upregulated FEZF1-AS1 levels had no effect on ESCC cell proliferation.
**P < 0.01, ***P < 0.001.
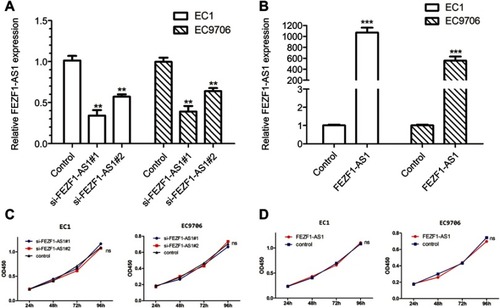
Figure 3 Impacts of FEZF1-AS1 on ESCC cell cycle. (A, B) The percentage of cells arresting in G1 phase and S phase in EC1 and EC9706 cell lines had no significant (ns) changes after FEZF1-AS1 knockdown. (C, D) There were no significant changes in EC1 and EC9706 cell cycles after FEZF1-AS1 overexpression.
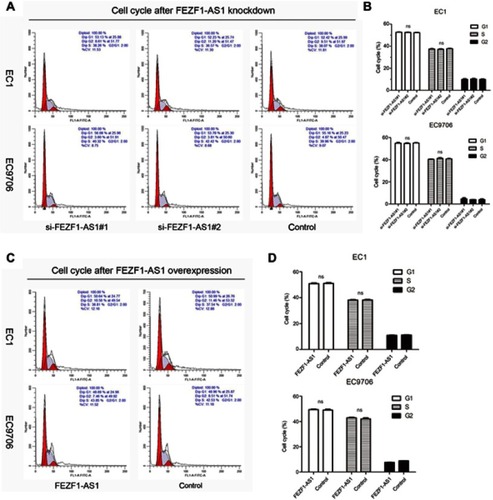
Figure 4 Knockdown of lncRNA FEZF1-AS1 expression inhibited ESCC cell migration and invasion in vitro. (A, B) Transwell assays demonstrated that silencing FEZF1-AS1 resulted in reduced EC1 and EC9706 cell migration and invasion; (C, D) statistical analysis showed that downregulated FEZF1-AS1 decreased the migration and invasion capacity of ESCC cells in vitro. (E, F) Scratch wound assay was performed in EC9706 cells, wound closure was reduced in si-FEZF1-AS1 groups compared to the control group. *P < 0.05, **P < 0.01, ***P < 0.001.
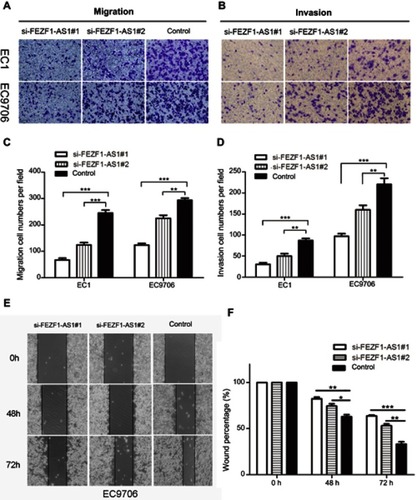
Figure 5 Overexpression of lncRNA FEZF1-AS1 significantly accelerated ESCC cell migration and invasion in vitro. (A, C) Transwell assays were performed in ESCC cell lines, upregulated FEZF1-AS1 resulted in boosted cell invasion and invasion; (B, D) statistical analysis indicated that upregulated FEZF1-AS1 increased the migration and invasion capacity of ESCC cells in vitro. ***P < 0.001.
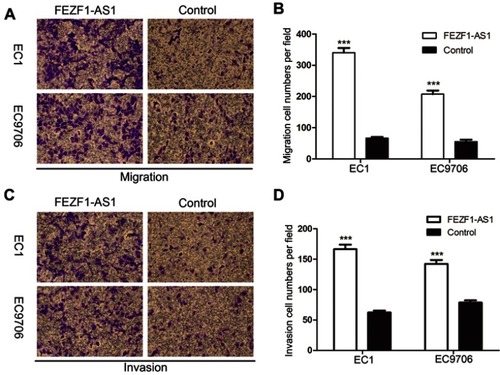
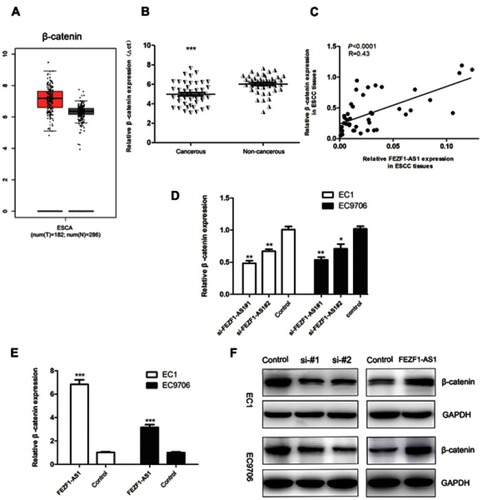
Figure 6 The expression levels of β-catenin in ESCC tissues, adjacent noncancerous tissues, and cell lines. (A) Expression profile of β-catenin in primary ESCC tissues and normal esophageal epithelium tissues (from GEPIA); (B) β-catenin was overexpressed in ESCC tissues (n=45); (C) The expression of β-catenin displayed an obvious positive correlated with the levels of lncRNA FEZF1-AS1 in ESCC tissues; (D) β-catenin levels in si-FEZF1-AS1#1 and si-FEZF1-AS1#1 cells were both decreased; (E) β-catenin levels in ESCC cell lines were increased after FEZF1-AS1 overexpression; (F) the levels of β-catenin protein were obviously decreased in cells which were transfected with si-FEZF1-AS1#1 and si-FEZF1-AS1#1, while they were increased in cells which were transfected with the GV219-FEZF1-AS1 *P < 0.05, **P < 0.01, ***P < 0.001.