Figures & data
Table 1 Baseline characteristics of pancreatic cancer patients (n=654)
Figure 1 Survival outcome of patients with metastatic pancreatic cancer according to year of diagnosis.
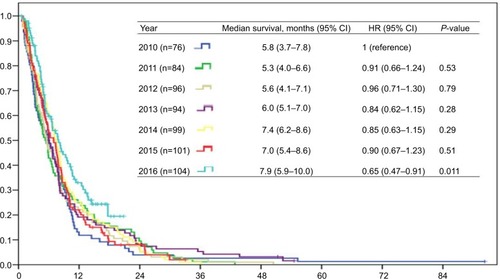
Figure 2 Crude 6-, 12-, and 24-month survival rates of pancreatic cancer patients, 2010–2016.
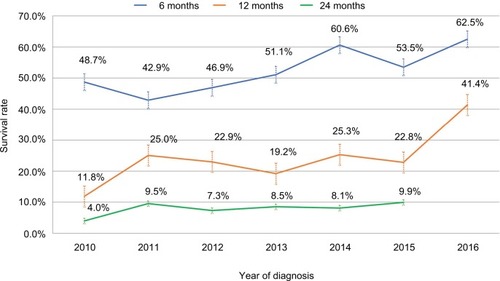
Table 2 Joinpoint analysis of trend for pancreatic cancer survival rate, 2010–2016
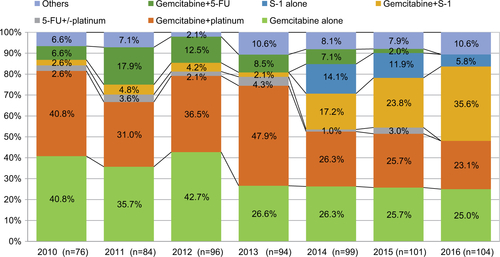
Figure 3 Chemotherapy agents received according to year of diagnosis.
Note: The subtraction of each single agent with different colors, blue, orange, and gray, indicating each used in the first, second, or third and above line of treatment settings, respectively.
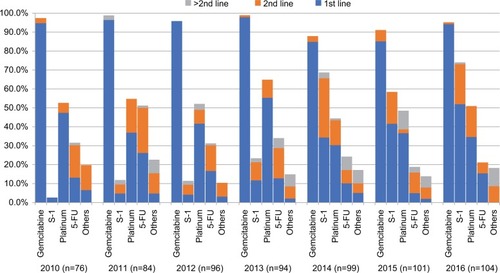
Table 3 Survival outcome of pancreatic cancer patients according to chemotherapy agents
Figure S1 Lines of chemotherapy treatment received by patients according to year of diagnosis.
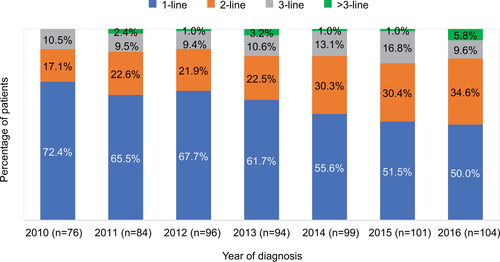
Figure S2 Chemotherapy regimens that patients received as first-line treatment in 2010–2016.